


Geopolitics of the Energy Transformation
Summary for Policy makers
The ongoing energy transition is unprecedented due to its scale and the profound impact on the established socio-economic, technological, and geopolitical trends around the world. Renewables, in combination with energy efficiency, now form the leading edge of a far-reaching global energy transition. This transition is not a fuel replacement; it is a shift to a different system with commensurate political, technical, environmental, and economic disruptions. The central question this report addresses is whether and to what extent hydrogen exacerbates or mitigates these disruptions and in what ways.
Hydrogen, until now the missing piece of the clean energy puzzle, is likely to further disrupt energy value chains in coming years. The climate change imperative has been the main driver of the renewed policy focus on hydrogen. IRENA’s 1.5°C scenario envisages that clean hydrogen1 could meet up to 12% of final energy consumption by 2050. Majority of this would be produced using renewables, with the rest from gas and carbon capture and storage.
Hydrogen is likely to influence the geography of energy trade, further regionalising energy relations. With the costs of renewable energy falling, but those of transporting hydrogen high, the emerging geopolitical map is likely to show growing regionalisation in energy relations. Renewables can be deployed in every country, and renewable electricity can be exported to neighbouring countries via transmission cables. In addition, hydrogen can facilitate transport of the energy renewables produce over longer distances via pipelines and shipping, thus unlocking untapped renewable resources in remote locations. Some existing natural gas pipelines, with technical modification, could be repurposed to carry hydrogen.
Countries with an abundance of low-cost renewable power could become producers of green hydrogen, with commensurate geoeconomic and geopolitical consequences. Green hydrogen could be most economical in locations that have the optimal combination of abundant renewable resources, space for solar or wind farms, and access to water, along with the capability to export to large demand centres. New power nodes could arise in places that exploit these factors to become centres of hydrogen production and use.
The hydrogen business will be more competitive and less lucrative than oil and gas. Clean hydrogen will not generate returns comparable to those of oil and gas today. Hydrogen is a conversion, not an extraction business, and has the potential to be produced competitively in many places. This will limit the possibilities of capturing economic rents akin to those generated by fossil fuels, which today account for some 2% of global GDP. Moreover, as the costs of green hydrogen fall, new and diverse participants will enter the market, making hydrogen even more competitive.
Hydrogen trade and investment flows will spawn new patterns of interdependence and bring shifts in bilateral relations. A fast-growing array of bilateral deals indicates that these will be different from the hydrocarbon-based energy relationships of the 20th century. More than 30 countries and regions have hydrogen strategies that include import or export plans, indicating that cross-border hydrogen trade is set to grow considerably. Countries that have not traditionally traded energy are establishing bilateral relations centering on hydrogen-related technologies and molecules. As economic ties between countries change, so might their political dynamics.
Map source: Natural Earth, 2021
Notes: Information on this fgure is based on the information contained in government documents at the time of writing.
Disclaimer: This map is provided for illustration purposes only. Boundaries and names shown on this map do not imply any endorsement or acceptance by IRENA.
Hydrogen diplomacy is becoming a standard fixture of economic diplomacy in several countries. Access to hydrogen is often seen as an element of energy security, and overall national resilience, particularly for industries where other solutions are not feasible or uneconomical. Some countries that expect to be importers are already engaged in dedicated hydrogen diplomacy. Germany and Japan have been trailblazers, but other countries are following close behind them. Potential exporters are deploying similar strategies, with many including hydrogen – green hydrogen in particular – at the highest levels of their diplomacy.
Fossil-fuel exporters consider clean hydrogen an attractive way to diversify their economies. Many current exporters are pivoting to clean hydrogen to develop new export industries. They can leverage established energy infrastructure, a skilled workforce and existing energy trade relations. While blue hydrogen seems like a natural fit, many fossil-fuel producing countries have ample renewable potential to shift directly to the green variety as well. United Arab Emirates’ Hydrogen Leadership Roadmap is explicitly taking such dual approach, and several others are exploring this path including Australia, Oman and Saudi Arabia. Nevertheless, fossil-fuel producers should continue to develop broad-based economic transition strategies, given that hydrogen will not compensate for loss in revenues.
The technical potential to produce green electricity – and, in turn, large amounts of green hydrogen – exceeds estimated global demand by several orders of magnitude. Many countries have declared their ambition to become exporters of hydrogen, limiting the likelihood of export concentration. Judging by their strategies and growing bilateral deals, even net energy importers such as Chile, Morocco and Namibia seem poised to become green hydrogen exporters. However, the supply of hydrogen will be constrained by the pace of deployment of capital and cost of production, particularly where long-term markets are not assured.
Africa, the Americas, the Middle East and Oceania have the highest technical potential for green hydrogen production. The ability to produce large volumes of low-cost green hydrogen, however, varies widely. Countries will have to set their strategies in light of broader social and economic priorities, including the ability to decarbonise their energy systems or tackle energy access and poverty, currently prevailing in over 80 countries worldwide. Having access to abundant renewables is an asset in the clean hydrogen race, but it might not be enough. Many other factors come into play, including existing infrastructure and the current energy mix, along with the cost of capital and access to necessary technologies. Whether the technical potential can be realised will also depend on soft factors like government support, the investment climate and political stability.
Higher project finance costs do not necessarily impede investment in countries with higher risk profiles. The upstream oil and gas sectors show that where revenue potential is sufficient, investment will flow in despite country risk. The same should apply to countries showing a low-cost potential for green hydrogen. There are limits, of course. Countries in turmoil, some of which have great potential, are unlikely to be able to realise investment opportunities owing to the immense risks of doing business in such locations.
The 2020s could become the era of a big race for technology leadership, as costs are likely to fall sharply with learning and scaling-up of needed infrastructure. The geopolitics of clean hydrogen is likely to play out in several stages. Green hydrogen is projected to start competing with blue on cost by the end of this decade. This seems likely to occur sooner in countries such as China (thanks to its low-cost electrolysers), or Brazil and India (with cheap renewables and relatively high gas prices). Green hydrogen was already more affordable than grey across Europe during the 2021 spike in natural gas prices. But the uptake will greatly depend on predictable demand, especially in harder to abate sectors where no alternatives exist.
Sources: IRENA (forthcoming-b).
Cross-border trading of hydrogen will increase in the 2030s, at pace with the cost-competitiveness of green hydrogen. Across many decarbonisation scenarios, demand starts to take off from 2035. IRENA envisages that two-thirds of green hydrogen production in 2050 would be used locally, and one-third traded across borders. Pipelines, including adapted natural gas pipelines, are likely to facilitate half of this trade. The other half would be loaded on ships in the form of hydrogen derivatives, notably ammonia.
In the short to medium term, countries and regions can assert technology leadership and shape the rules of the growing market. Having a stake in the hydrogen value chain can boost economic competitiveness. The direct economic stakes are high, and the market potential is considerable. In the long run, countries with ample renewable potential could become sites of green industrialisation, using their potential to attract energy-intensive industries.
Equipment manufacturing offers an opportunity to capture value in the coming years and decades. The hydrogen value chain is extensive, and the bulk of investment will be needed for renewable power. Along this value chain, estimates point to a USD 50-60 billion market potential for electrolysers and a USD 21-25 billion market for fuel cells by the middle of the century. China, Europe and Japan have developed a strong head start in producing and selling electrolysers, but the market is still nascent and relatively small. Innovation and emerging technologies can change the current manufacturing landscape.
Any form of hydrogen may strengthen energy independence and resilience, but most of the benefits stand to come from green hydrogen. Today, there are three main ways in which hydrogen can bolster energy security: 1) by reducing import dependence, 2) by mitigating price volatility and 3) by boosting the flexibility and resilience of the energy system, through diversification. Most of these benefits are associated with green hydrogen. Conversely, blue hydrogen would follow the patterns of gas markets, resulting in import dependencies and market volatilities. Moreover, the expected cost reduction in green hydrogen means that investments in supply chains based on fossil fuels – especially assets planned to stay in operation for many years – may end up stranded.
The raw materials needed for hydrogen and renewable energy technologies are likely to draw more attention to material security. While geological supplies for most minerals and metals are presently sufficient, markets could become very tight owing to rapidly rising demand, and the long lead times of mining and refining projects. A relatively small shift in supply or demand can cause significant price fluctuations. Such fluctuations could reverberate through hydrogen supply chains and affect the overall cost of equipment, along with the revenues of miners and exporters of raw materials. Supply chain problems caused by COVID-19 are also instructive when considering possible risks beyond those already well-known.
Hydrogen trade flows are unlikely to become weaponised or cartelised. This is because hydrogen can be produced from many primary energy sources and in a wide variety of places worldwide. Indeed, it is a manufactured product rather than a raw material or energy source. Therefore, green energy trade flows are unlikely to lend themselves as easily to geopolitical influence as oil and gas. That said, supply shortages could arise, particularly in the early years of hydrogen trade, when the number of suppliers is limited and most trade is still governed by bilateral arrangements.
Shaping the rules, standards and governance for hydrogen trade will have a significant impact in determining which technologies dominate future markets. The success of clean hydrogen markets hinges upon the ability to set coherent and transparent rules, standards and norms to facilitate its deployment across countries, regions and sectors. Standards are designed to improve the quality, safety, and interoperability of various goods and services. At the same time, divergent standards could slow down progress and lead to market fragmentation, stir regulatory competition, and erect trade barriers. Setting standards could be an arena for geopolitical competition or international co-operation. Ultimately, all players can gain from a coherent and transparent global system.
Certificates of origin rooted in a transparent and credible international system will be needed to monitor and manage hydrogen’s contribution to climate change efforts. Transparency in how emissions are measured will be essential. There are well-known risks of carbon lock-in if hydrogen strategies prolong fossil fuel use and hinder energy efficiency and electrification. Robust and well-thought-out policy frameworks can help ensure that hydrogen effectively contributes to reducing greenhouse gas emissions.
Price transparency early on would support the rapid evolution of the global market in hydrogen. The currencies and pricing mechanisms that take hold in the emerging market are likely to have considerable geopolitical effects. The currency chosen will be positioned to become a global benchmark as the market expands. Those associated with that currency will to some degree be sheltered from exposure due to fluctuating import costs. For instance, the European Union, likely to become one of the key import markets, seeks to denominate its future hydrogen imports in euros. Moreover, putting a price on carbon might be helpful, or even necessary, to make green hydrogen competitive with the grey variant and, ultimately, with fossil fuels. In that sense, hydrogen may become embroiled in a broader set of carbon trade wars.
Investment decisions are long-lived and the risks of stranded assets high, so fixed infrastructure should be assessed with a long-term logic. Every investment and planning decision around energy infrastructure today should consider that the geography of a decarbonised economy is likely to be very different from what currently makes sense. Significant electrification of end uses will reshape demand. On the supply side, renewable hydrogen production will likely occur in locations other than today’s oil and gas fields. While some of the existing infrastructure could be repurposed, the technical challenges and economic costs of such repurposing should be accounted for from the outset.
Helping developing countries deploy hydrogen technologies early on could improve energy security for all, while preventing the global decarbonisation divide from widening. A diverse hydrogen market would reduce supply chain risks and improve energy security for all. Access to technology, training, capacity building and affordable finance will be key to realising the full potential of hydrogen to decarbonise the global energy system and contribute to global stability and equity. Establishing hydrogen trade relations could open new possibilities to set up local hydrogen value chains, stimulate green industries and create jobs in countries rich in renewables.
Global efforts should focus on the applications that provide the most immediate advantages and enable economies of scale, particularly in the coming years. Prioritising high-demand applications for which hydrogen is the best — and perhaps the only — alternative is more likely to be cost-effective and less susceptible to the risks of nascent markets. One example could be supporting and then accelerating a shift to green hydrogen in industrial applications where hydrogen is already used, such as refining and the production of ammonia and methanol.
Depending on how it is developed, hydrogen could have both positive and negative effects on sustainable development. The concept of “human security” is often used to describe the root causes of geopolitical instability to account for threats such as climate change, poverty and disease, which can undermine peace and stability within and between countries. Going forward, it will be important to gain greater understanding of the multidimensional nature of global threats and vulnerabilities to foresee and defuse certain risks that may come with the deployment of hydrogen on a major scale.
1.1 The dawn of clean hydrogen
In recent years, hydrogen has risen up the agenda as a potential missing piece of the clean energy puzzle. A growing number of countries now have a national hydrogen roadmap or strategy, and a sizeable portion of the COVID-19 stimulus and recovery funds have been dedicated to the acceleration of hydrogen. At the 2021 United Nations Climate Change Conference (COP26) in Glasgow, 32 countries and the European Union (EU) agreed to work together to accelerate the development and deployment of clean hydrogen (Box 1.1) and ensure that “affordable renewable and low-carbon hydrogen is globally available by 2030” (UNFCCC, 2021).
Hydrogen has spurred multiple waves of interest in the past without significant impact. Two factors make this time different. First, governments worldwide have rallied behind the target of net zero emissions by the middle of this century (Black et al., 2021). Having a reasonable chance of limiting global temperature rise to 1.5°C, the goal laid out in the 2015 Paris Agreement, requires reaching net zero emissions by 2050 (IPCC, 2021). To do so, all sectors of the economy need to cut their emissions, including heavy industry and long-haul transport, where limited solutions exist. Hydrogen has emerged as a key option for reducing emissions in these sectors. Second, the plummeting costs of renewables and electrolysers are improving the economic attractiveness of "green" hydrogen – that is, hydrogen produced through the electrolysis of water powered by renewable electricity. The increasing share of variable renewables, such as wind and photovoltaic (PV) solar power, also creates demand for flexibility and storage, which hydrogen can help deliver. Green hydrogen can thus complement and extend the ongoing revolution in renewable electricity. As a result of these factors, hydrogen and hydrogen-based fuels are now projected to meet a sizeable share of final energy demand in 2050, up from virtually nothing today (Figure 1.1). In all of these projections, current “grey” hydrogen production (based on fossil fuels) is completely phased out, and green hydrogen is the dominant production pathway, complemented by “blue” hydrogen, which is based on fossil fuels with carbon capture and storage (CCS).
BOX 1.1 Key terms used in this report
- Clean hydrogen refers to both green hydrogen and blue hydrogen. Although both types may play a role in the energy transition, for the purpose of this report, blue hydrogen was conceptualised as “clean” where methane emissions are extremely low and with very high carbon capture rates.
- Low-carbon hydrogen refers to blue hydrogen that does not meet the emission standards above and to hydrogen made with grid-powered electrolysis where the grid is not decarbonised.
- Hydrogen derivatives refer to the downstream molecules into which hydrogen can be converted (e.g. ammonia, methanol, synthetic fuels). When these products are produced with hydrogen from electrolysis, they are known as “Power-to-X” products.
- Synthetic fuels refer to a variety of gaseous and liquid fuels produced from hydrogen and carbon, including synthetic kerosene, synthetic diesel and others. When hydrogen is produced by electrolysis, these fuels are also referred to as “powerfuels” or “e-fuels”. They can be used as “dropin” fuels, as they can be used in conventional engines and fuel supply infrastructure.
Hydrogen has spurred multiple waves of interest in the past without significant impact. Two factors make this time different. First, governments worldwide have rallied behind the target of net zero emissions by the middle of this century (Black et al., 2021). Having a reasonable chance of limiting global temperature rise to 1.5°C, the goal laid out in the 2015 Paris Agreement, requires reaching net zero emissions by 2050 (IPCC, 2021). To do so, all sectors of the economy need to cut their emissions, including heavy industry and long-haul transport, where limited solutions exist. Hydrogen has emerged as a key option for reducing emissions in these sectors.
Second, the plummeting costs of renewables and electrolysers are improving the economic attractiveness of "green" hydrogen – that is, hydrogen produced through the electrolysis of water powered by renewable electricity. The increasing share of variable renewables, such as wind and photovoltaic (PV) solar power, also creates demand for flexibility and storage, which hydrogen can help deliver. Green hydrogen can thus complement and extend the ongoing revolution in renewable electricity.
As a result of these factors, hydrogen and hydrogen-based fuels are now projected to meet a sizeable share of final energy demand in 2050, up from virtually nothing today (Figure 1.1). In all of these projections, current “grey” hydrogen production (based on fossil fuels) is completely phased out, and green hydrogen is the dominant production pathway, complemented by “blue” hydrogen, which is based on fossil fuels with carbon capture and storage (CCS).
Figure 1.1 Estimates for global hydrogen demand in 2050
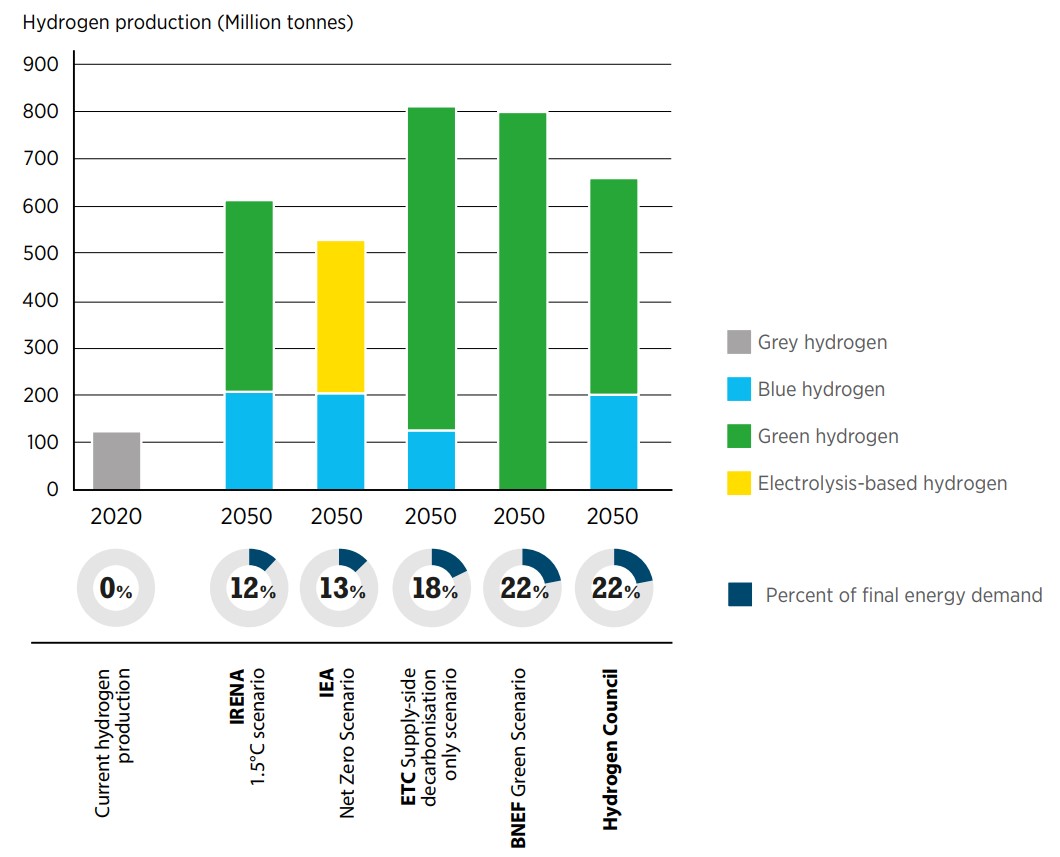
Notes: The International Energy Agency refers to “fossil-based with CCUS” (carbon capture, utilisation and storage) and “electrolysis-based” hydrogen. The Hydrogen Council projects that 60-80% of hydrogen production will be renewables based, with the rest “low-carbon”, which it defines as “hydrogen produced from energy sources of non-renewable origin with a carbon footprint below a defined threshold”. Current hydrogen production includes hydrogen created as byproduct from other processes.
1.2 Geopolitical significance of clean hydrogen
Building up global clean hydrogen value chains will bring geoeconomic and geopolitical shifts. Most notably, green hydrogen is emerging as a potential game changer for reducing emissions and achieving climate neutrality without stymying economic and social development.
The economic stakes are high. Current annual hydrogen sales represent a market value of approximately USD 174 billion, which already exceeds the value of annual trade in liquefied natural gas (LNG).2 Even if hydrogen’s use is limited to industrial processes and long-distance transport, its market potential is enormous. A single steel plant using hydrogen rather than fossil fuel to reduce iron would utilise about300 000 tonnes of hydrogen annually, absorbing the output of 5 gigawatts (GW) of electrolysers (Mission Possible Partnership, 2021). Global electrolyser capacity today stands at just over 0.3 GW. According to major investment banks, by 2050, global sales of hydrogen could be worth USD 600 billion (Financial Times, 2021), and the value chains of green hydrogen could become a USD 11.7 trillion investment opportunity over the next 30 years,3 covering everything from dedicated renewable capacity and electrolysers, to transport infrastructure (Goldman Sachs, 2020).
Hydrogen’s transformative reach goes beyond its estimated market value. It is best thought of as a general-purpose energy carrier that can foster innovation across many different industries and sectors. Its geopolitical impact might follow the patterns of steam power, electricity, or the internal combustion engine. Each in their own way, these technologies have transformed the machines and fuels on which much of our modern civilization runs. In the process, they have also affected different aspects of human life, altered global trade patterns, and shaped the global balance of power. While these technologies have brought many benefits to humankind, the benefits have not been fairly distributed. They have therefore saddled societies with new externalities and global challenges.
Compared to these epoch-defining technologies, clean hydrogen’s impact will likely be smaller, but it should not be brushed aside too quickly. Behind the simple chemical formula of hydrogen gas (H2), lies an entire system of infrastructure to produce, transport, convert and use hydrogen. Such a system could create new connections between the previously separated energy sectors of power, heat, and mobility. It could foster partnerships that transcend traditional industry boundaries. More importantly, the push to develop clean hydrogen as a major energy carrier is likely to disrupt current energy value chains and create opportunities for more countries to play a significant role. Eventually, it might even lead to an entirely new economic geography of industrial activity.
The geopolitics of clean hydrogen is likely to play out in different stages. The 2020s could be the era of the big race for technology leadership, with costs falling significantly and rapid scaling up of the required infrastructure. In many locations, green hydrogen is set to compete on costs with blue by 2030 (IRENA, 2020a). Across many decarbonisation scenarios, demand starts to take off from 2035 (World Energy Council, 2021). During this period, international trade of hydrogen and derivatives could grow significantly, although initial trading routes might be established earlier (Ram et al., 2020).
1.3 Objectives of the report
This report provides a comprehensive analysis of the geopolitical drivers and potential consequences of the development of clean hydrogen value chains.
A central theme around which this report is built is the concept of ‘disruption’. We are witnessing transformations in many aspects of economies and societies, ranging from energy systems, climate change, technological trajectories, geopolitical relationships, and trade and investment. Given the turbulence of political, technical, environmental, and economic systems, the central question this report addresses is whether, and to what extent, hydrogen exacerbates or mitigates these disruptions, and who benefits or may be disadvantaged by these developments. The goal of this report is not only to describe how hydrogen can disrupt future energy systems, but also offer insights into how countries and stakeholders can prepare for positive or negative disruptions.
The possible pathway on which clean hydrogen might evolve still involves many uncertainties. This report is therefore a horizon scanning exercise that is exploratory in nature. The 1.5°C scenario of the International Renewable Energy Agency (IRENA), as depicted in the Agency’s World Energy Transitions Outlook (WETO), is used as a baseline for the analysis (Box 1.2) (IRENA, 2021a). However, this report focuses not only on the geopolitical implications of a defined hydrogen pathway, but also on the ways in which different actors are actively trying to shape multiple potential pathways for the development of hydrogen.
Two surveys were conducted to inform the analysis in this report (Box 2.2). One polled IRENA Members,4 the other a group of topical experts. The report also draws on the substantial body of work that IRENA has already carried out on hydrogen and related topics, from technical, economic and policy perspectives. It further draws on the work of experts worldwide, including those participating in IRENA’s Collaborative Framework on the Geopolitics of Energy Transformation.
This report reflects on many of the key themes covered by the 2019 Global Commission report (IRENA, 2019a), including technology leadership, energy security and shifting trade patterns, among others. It outlines policy considerations for governments and other actors to help mitigate the geopolitical risks and capitalise on opportunities.
BOX 1.2 KEY PROJECTIONS OF HYDROGEN USE BY 2050 IN IRENA’S 1.5°C SCENARIO
- Hydrogen and its derivatives account for 12% of final energy use and 10% of carbon dioxide (CO2) emissions reductions. They play an important role in harder-to-decarbonise, energy-intensive sectors like steel, chemicals, long-haul transport, shipping and aviation. Hydrogen also helps balance the supply of and demand for renewable electricity and serves as long-term seasonal storage.
- Some 5 000 GW of hydrogen electrolyser capacity are needed, up from just 0.3 GW today.
- The electricity demand to produce hydrogen reaches close to 21 000 terawatt hours (TWh), almost the level of global electricity consumption today.
- The production of green hydrogen and its derivatives will use 30% of the total electricity demand in 2050.
- At least two-thirds of total production is green hydrogen, with the rest coming from blue hydrogen.
2.1 What is hydrogen?
Hydrogen is the oldest, lightest and most abundant element in the universe. It is naturally present in many compounds, including water and fossil fuels.
Hydrogen gas is used mainly as a feedstock for the (petro)chemical industry: crude oil refining, ammonia synthesis (primarily for fertiliser production) and methanol production for a wide variety of products (including plastics).
Around 120 million tonnes of hydrogen is produced globally, twothirds of which is pure hydrogen and one-third of which is a mixture with other gases (IEA, 2019a). China is the world’s largest producer and consumer of hydrogen (Figure 2.1). It produces almost 24 million tonnes of pure hydrogen per year, accounting for nearly one-third of dedicated global production.
Hydrogen can also be used as a fuel. When burned, it can generate heat of more than 1 000°C without emitting CO2.5 Further, hydrogen can also be used in fuel cells, where it chemically reacts with oxygen to produce electricity without emitting any pollutants or greenhouse gases. The only by-product of this chemical reaction is water vapour.
Figure 2.1 Hydrogen consumption in 2020 (million tonnes per year)
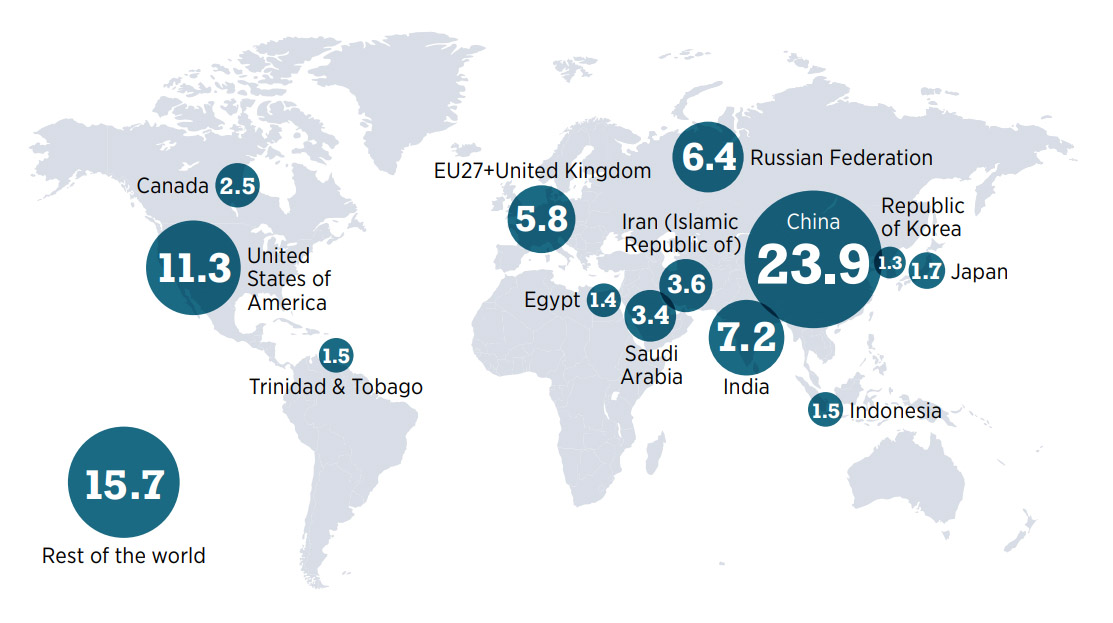
Note: Values are derived from current production of ammonia, methanol, refining and direct reduced iron for steel.
Disclaimer: This map is provided for illustration purposes only. Boundaries and names shown on this map do not imply any endorsement or acceptance by IRENA.
2.2 Main production pathways
Despite its abundance on Earth, hydrogen does not exist naturally in its pure form in large quantities. There are no vast deposits of hydrogen in the ground that can be extracted.6 Hydrogen is found almost exclusively in compounds, notably water molecules (hydrogen and oxygen) and fossil fuels (hydrogen and carbon). Hydrogen can be released from these compounds, but doing so requires energy.
A colour-code system is commonly used to refer to different hydrogen production methods (Figure 2.2). Most hydrogen today is grey hydrogen, which is produced using fossil fuels, notably through steam methane reforming of natural gas or gasification of coal.7 These fossil fuel-based production methods, which account for 95% of today’s hydrogen supply, result in a substantial CO2 footprint and are not compatible with moving towards net zero emissions.
Two main routes are under consideration to replace grey hydrogen with a clean form of production: green and blue hydrogen. Green hydrogen production is fully consistent with the net zero route. It relies on technologies that have long been well known, based on water electrolysis (Box 2.1) powered by renewable electricity. Currently, hydrogen production from renewable sources is limited, but this is set to change with the global focus on its potential.
Blue hydrogen is produced from fossil fuels with CCS. Retrofitting CCS to grey hydrogen production facilities would allow continued use of these assets with lower greenhouse gas emissions. However, blue hydrogen relies on fossil gas, which brings risks of upstream or midstream leakages of methane, a much more potent greenhouse gas than CO2. Blue hydrogen can thus yield very low greenhouse gas emissions, only if methane leakage emissions do not exceed 0.2%,8 with close to 100% carbon capture. Such rates are still to be demonstrated at scale (Bauer et al., 2021; Howarth and Jacobson, 2021; IEA, 2021b; IRENA, 2020b; Saunois et al., 2016).
Blue hydrogen has other limitations that have restricted its deployment. It uses fossil fuels, exposing it to price fluctuations, such as the price spike in late 2021 in many parts of the world, notably Asia and Europe (Collins, 2021a), and does not support the goals of climate resilience or energy security. It also adds CO2 transport and storage costs and requires monitoring of stored CO2.
However, if blue hydrogen meets strict emissions criteria, it could play an important role in scaling up hydrogen volumes in the short-to-medium term and drive the development of related infrastructure and technologies along the value chain. Moreover, blue hydrogen could offer additional flexibility in the hydrogen market. In the long run, however, green hydrogen is a zero-carbon solution and should therefore be the endgame.
Other low-carbon pathways for hydrogen production exist. One option is “turquoise” hydrogen, which relies on pyrolysis of methane (natural gas), which does not emit CO2. The only by-product of this process is the solid material “carbon black”, for which there is an existing market, albeit a relatively small one. Another option is “pink” hydrogen, from nuclear electricity. A third is biomass gasification with CCS, which can result in negative CO2 emissions. None of these types of hydrogen is included in this report, which gives priority to more developed production methods.
BOX 2.1 What is an electrolyser?
Electrolysis is the chemical process that produces hydrogen from water and electricity. Electrolysers – devices that can split water into oxygen and hydrogen – were invented over 200 years ago.
Multiple water electrolyser technologies exist. Four of them hold promise: alkaline, proton exchange membrane (PEM), solid oxide electrolyser cells (SOEC) and anion exchange membrane (AEM). All of the installed electrolyser capacity uses either alkaline or PEM technologies. AEM electrolysers are still relatively new and have limited deployment; their potential advantages lie in the fact that they use no precious metals and use a membrane that is less expensive than that used for PEM.
Table 2.1 Main electrolyser technology comparison
| Type | Commercial Status | Considerations |
|---|---|---|
| Alkaline | Mature |
|
| Proton exchange membrane(PEM) | Commercial, fast growth |
|
| Solid oxide electrolyser cells (SOEC) | Demonstration plants |
|
| Anion exchange membrane (AEM) | Limited deployment |
|
2.3 Hydrogen applications and priority setting
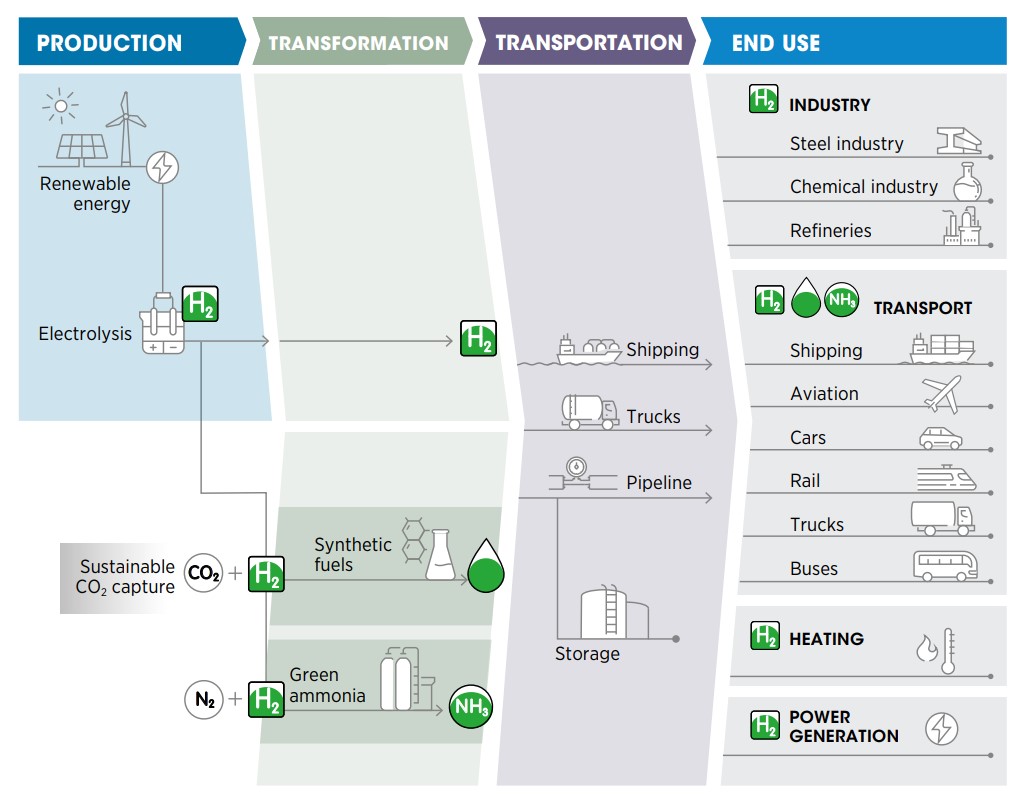
Hydrogen is a versatile energy carrier that can be used in many applications. Figure 2.3 shows the potential uses for hydrogen, some of which can provide early demand for hydrogen and help the industry take off.
Figure 2.3 Potential uses for clean hydrogen
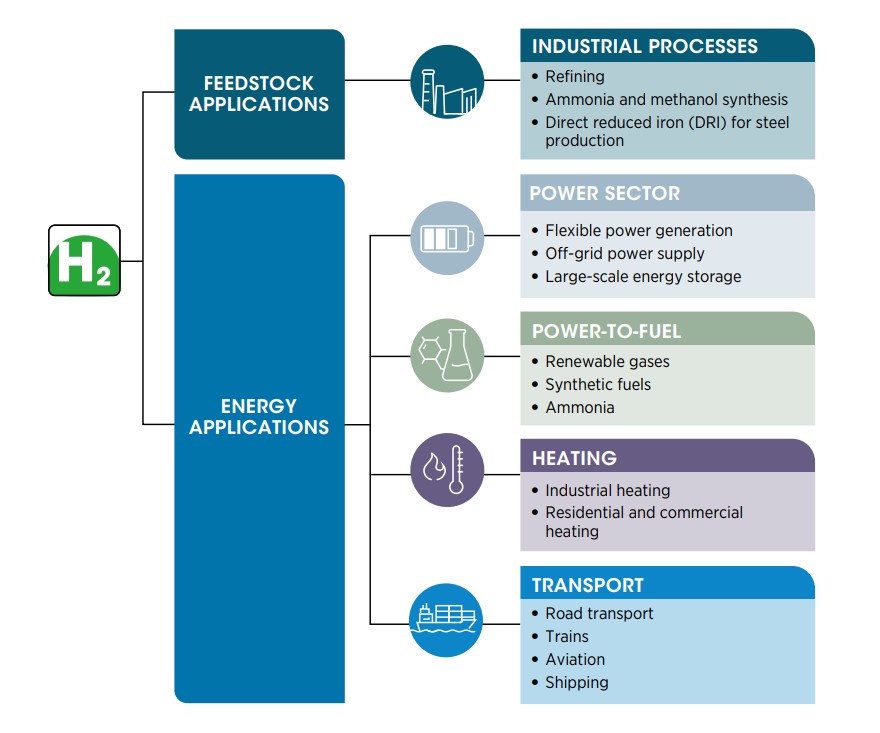
Decarbonisation strategies require careful management to ensure that the technologies and solutions selected are most efficiently deployed. Thus, the wide array of options calls for identification of uses in which hydrogen can provide the most value. Its production, transport and conversion require energy, raising overall demand. Indiscriminate use can slow the energy transition, also diluting the decarbonisation efforts of the power generation sector. Hydrogen is therefore best reserved for the uses that currently have no viable alternative. Figure 2.4 compares possible end uses based on the size of application and the maturity of hydrogen solutions compared with electricity-based ones. Policy attention should be given to the more mature and centralised hydrogen solutions. This attention can involve dedicated research, planning and supporting policies (IRENA, forthcoming-b).
Making the shift to a truly sustainable economy is not simply about switching energy sources and keeping the current energy system; more efficient, just and equitable ways of using energy must be developed. Doing so involves reducing unnecessary energy consumption across many final uses and changing the current economic system, which is based on continuously increasing consumption. In heavy industry, for example, 40% of CO2 emissions could be saved by reusing steel, aluminium and plastics more effectively (Lovins, 2021a). Another example would be a modal shift from short-distance flights to electrified trains, where possible, to reduce demand
2.4 Barriers to scaling up hydrogen
The following barriers currently prevent clean hydrogen from making a larger contribution to the energytransformation:
- Cost: The cost of clean hydrogen, particular green hydrogen, is still high relative to high-carbon fuels. Not only the cost of production but the costs of transporting, converting and storing hydrogen are also high. Adopting clean hydrogen technologies for end uses can be expensive and CCS is yet to be deployed at scale.
- Technological maturity: Some technologies in the hydrogen value chain required for decarbonisation still have a low level of technological readiness and need to be proven at scale. For instance, gas turbines that operate exclusively with hydrogen are not currently available off the shelf, and when it comes to maritime trade, there is only one prototype vessel that can transport liquid hydrogen.
- Efficiency: Hydrogen production and conversion incur significant energy losses at each stage of the value chain, including production, transport, conversion and use. Moreover, production of blue hydrogen is energy-intensive, adding to overall energy demand.
- Sufficient renewable electricity: By 2050, the production of hydrogen with electrolysers may consume close to 21000 TWh – almost as much electricity as is produced globally today (IRENA, 2021a). As more end-use sectors are electrified, a lack of sufficient renewable electricity may become a bottleneck for green hydrogen.
- Policy and regulatory uncertainty: Although over 140 countries have pledged to achieve net zero emissions within the coming decades, the speed with which these goals will be achieved remains uncertain. Stable, long-term policy frameworks are needed to support development and deployment at scale.
- Standards and certification: Countries lack institutionalised mechanisms to track the production and consumption of any shade of hydrogen and identify its characteristics (e.g. origin and life-cycle emissions) (IRENA, 2020b; IRENA, IEA and REN21, 2020).9 Moreover, hydrogen is not counted in official statistics of total final energy consumption and the economic value of clean hydrogen’s contribution to emission reductions is not recognised.
- Chicken-and-egg problem: There is a chicken-and-egg problem in building out the necessary infrastructure for hydrogen. Without demand, investments remain too risky for wide-scale production that could reduce costs, but without economies of scale the technology remains too costly.
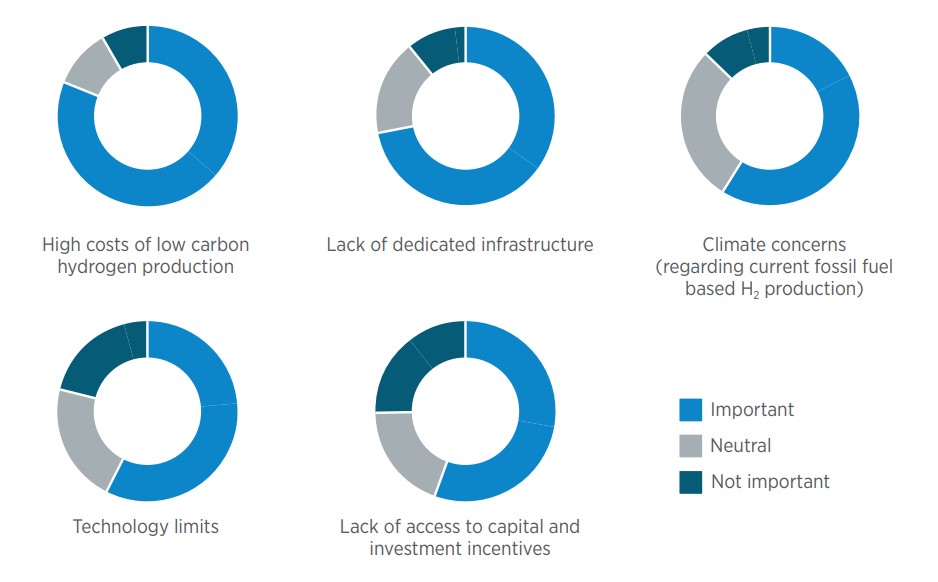
Figure 2.5 Main perceived barriers to develop hydrogen policies and strategies
BOX 2.2 Geopolitics of hydrogen surveys
For an emerging and rapidly evolving topic that has gathered widespread interest, two voluntary surveys were designed to garner feedback from policy makers and industry experts to provide a baseline for observing hydrogen sector developments.
The first survey was focused on gathering input from countries to develop a high-level understanding of country plans and associated drivers and barriers of hydrogen’s role in the energy transition. The survey was issued to IRENA’s Membership, 164 countries and the EU at the time. A total of 48 responses from 37 Members were received.
A second survey was issued to target topical experts (purposive sampling) to gather more technical views. Under this second survey, 162 experts were approached, and 78 responses received. Input received was analysed and aggregated. Selected outputs are provided throughout this report. The full survey results are available in a digital annex.
2.5 Prospects for international hydrogen trade
Today, hydrogen is a very local business. About 85% of hydrogen gas is produced and consumed on-site within a facility rather than bought and sold on the wider market (IEA, 2019a). Even where hydrogen is sold, it is usually not transported across large distances because of the logistical difficulties and costs.
Over time, hydrogen could become an internationally traded commodity. The green variety offers additional means to “ship sunshine”, that is, transport solar and other renewables across borders. The single-largest cost component of producing green hydrogen is the cost of electricity (IRENA, 2020a). As the levelised cost of renewables differs significantly across regions, the price of hydrogen will also differ.10 Green hydrogen will be most economically produced in locations that have an optimal combination of abundant renewable resources (Figure 2.6 and Figure 2.7), available land, access to water and the ability to transport and export energy to large demand centres.
Figure 2.6 World solar technical potential
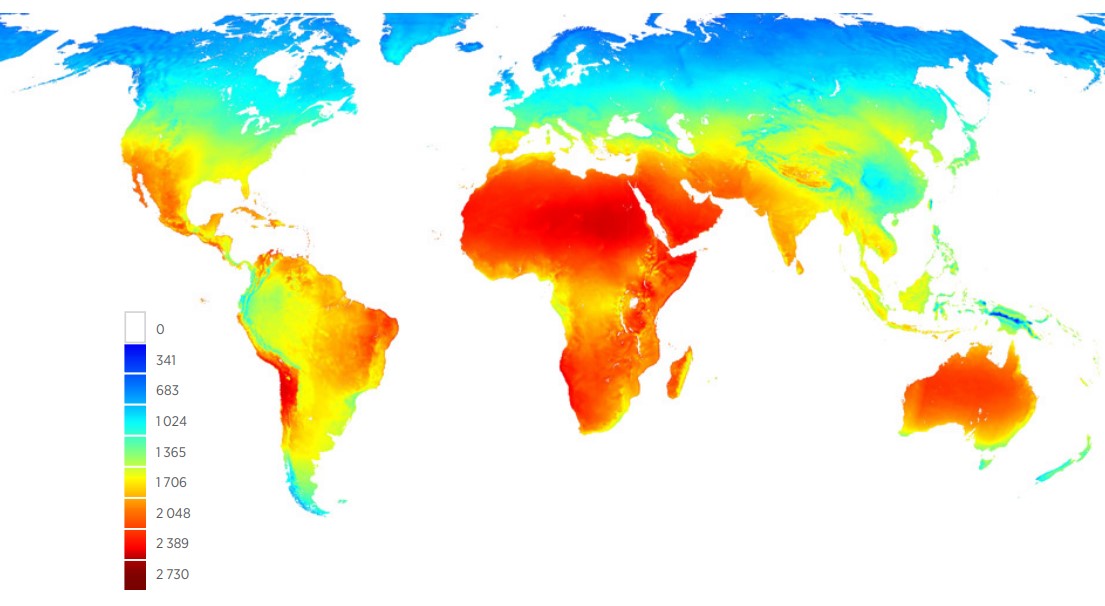
Note: Annual average global horizontal irradiation (kWh/m2). Also available on the IRENA Global Atlas for Renewable Energy web platform.
Disclaimer: This map is provided for illustration purposes only. Boundaries shown on this map do not imply any endorsement or acceptance by IRENA.
Figure 2.7 World wind technical potential
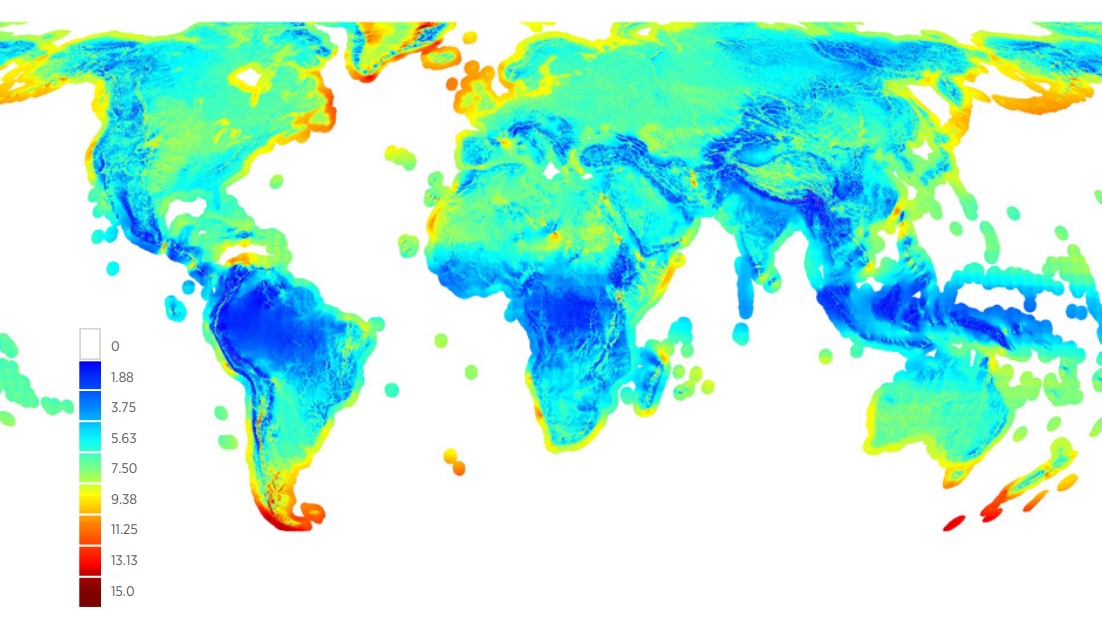
Note: Annual average wind speed at 100 metres (m/s). Also available on the IRENA Global Atlas for Renewable Energy web platform.
Disclaimer: This map is provided for illustration purposes only. Boundaries shown on this map do not imply any endorsement or acceptance by IRENA.
There are two main modes for transporting hydrogen across borders: pipelines and ships.11 Distance and volume determine which mode is cheapest (Figure 2.8). For instance, with small volumes (e.g. 0.3 million tonnes of hydrogen per year), pipelines could be cheaper than ships for distances below 1 500 km. For large volumes (e.g. 1.5 million tonnes of hydrogen per year), newly built hydrogen pipelines would be the most cost-effective option for distances up to 4 000 km. In cases where repurposed natural gas pipelines are an option,12 the cost effective range extends to 8 000 km. To put some of these distances into perspective, connecting Windhoek, Namibia to Johannesburg, South Africa, would require a pipeline of about 1 500 km. Connecting Toronto, Canada to Mexico City, Mexico would require a pipeline of about 4 000 km. Shipping from Chile to Japan is almost 17 000 km.
Figure 2.8 Cost efficiency of transport options when considering volume and distance
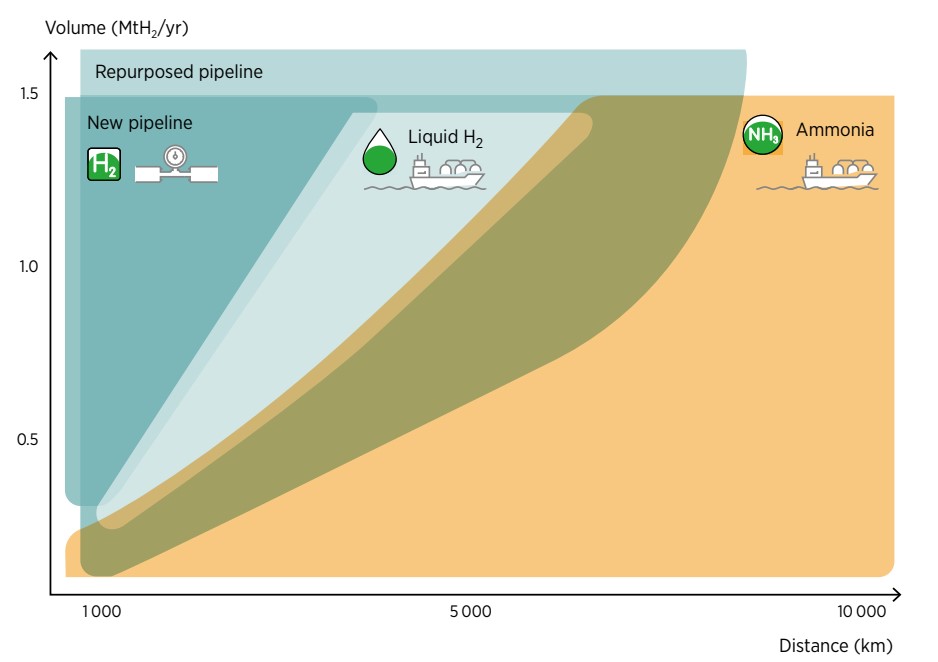
Note: H2 = hydrogen gas; km = kilometre. MtH2/yr = million tonnes of hydrogen per year.
There are about 4 600 km of dedicated hydrogen transmission pipelines operating in north-western Europe, the Russian Federation (Russia) and the United States of America (United States). Plans are in the making for trunk pipeline systems in Europe, called the “hydrogen backbone” (Gas for Climate, 2021a). It is also possible to simply transmit renewable electricity via cables and transform it into hydrogen at the end of the line. Whether a pipeline or a cable is the optimal solution depends on several factors, including the desired end product, the topography of the terrain, and the distance.
Hydrogen transport by ship is technically possible for larger distances where pipelines are not an option. Because of its low energy density by volume,13 gaseous hydrogen is best converted into a more energydense liquid before being loaded onto a ship. There are several vectors for hydrogen transport via ship (Box 2.3), but ammonia is the most promising. It is already an internationally traded commodity, with some 18 million tonnes traded in 2020 (about 10% of global production) (Atchison, 2021).
BOX 2.3 Three main ways to transport hydrogen by ship
Liquid hydrogen. The hydrogen molecules must be cooled to -253°C at port terminals before being loaded onto highly insulated tanker ships. As a result, the liquefaction process consumes 25–35% of the initial quantity of hydrogen. Currently, only one ocean-going ship can transport pure hydrogen, the Suiso Frontier, built by Kawasaki in late 2019 and on its first route to Australia in late 2021 (Harding, 2019).
Liquid organic hydrogen carriers (LOHCs). A slate of different organic compounds can absorb and release hydrogen through a chemical reaction. LOHCs can serve as a storage and transportation medium for hydrogen and can be transported as liquids without cooling. LOHCs are very similar to crude oil and oil products, so the existing oil transport infrastructure could even be adapted to transport LOHCs (Niermann et al., 2019).
Ammonia. Hydrogen can be turned into ammonia by reacting with nitrogen from the air, using nothing but electricity, water and air. Ammonia has a much higher energy density than hydrogen that means a larger volume of energy can be traded. There is a well-established international trade in ammonia that can be leveraged. It is currently used as a feedstock, notably to make fertilisers. It could also be used as a decarbonisation fuel, such as in the shipping industry and power generation. The downside is that ammonia is toxic if leakages occur and a potential source of nitrogen oxide emissions.
Hydrogen transport costs are still very high, but they are set to come down thanks to economies of scale, lower project risks and improvements in technology. Trade could be scaled up more rapidly in blue hydrogen than green, because it currently enjoys lower production costs and benefits from existing gas infrastructure. Green hydrogen trade is expected to increase towards 2030, thanks to improving economies of scale and the adoption of enabling policies, which will decrease production costs.
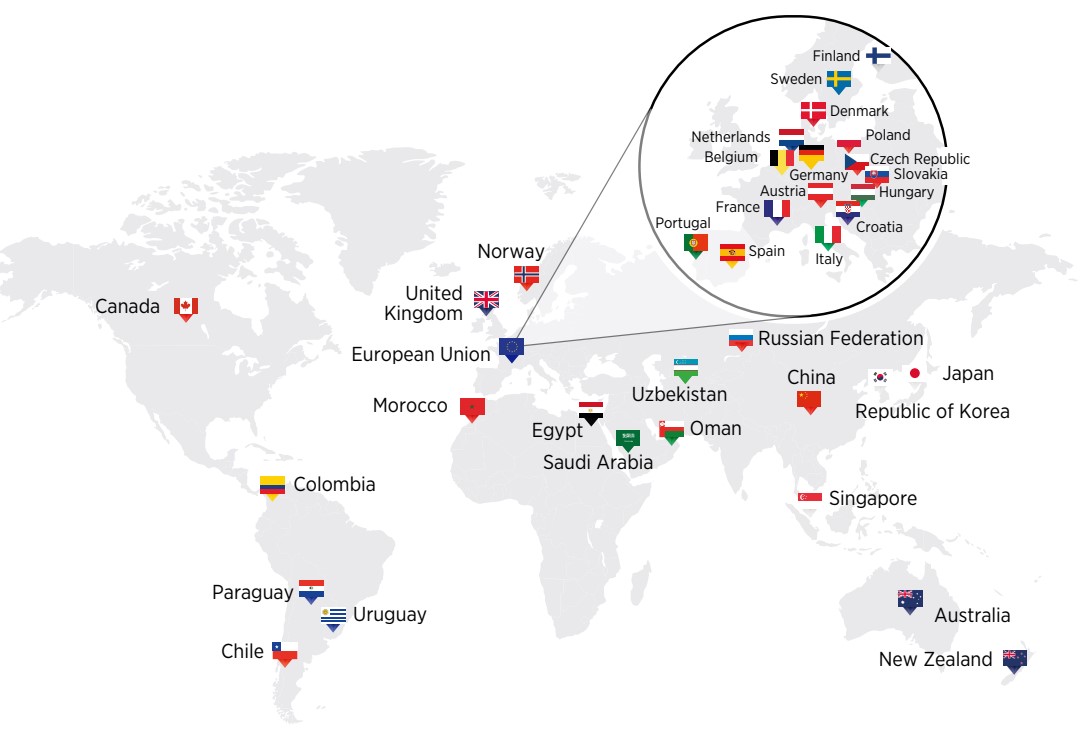
IRENA analysis suggests that about one-third of green hydrogen would be traded across borders by 2050 (IRENA, forthcoming-a). This share is slightly larger than today’s share of natural gas traded globally (24%). About half of the hydrogen trade in 2050 is likely to go through pipelines, including repurposed natural gas pipelines that exist today. The other half would be transported by long-haul ships in the form of ammonia. This situation is akin to that of natural gas, which is split into regional pipeline-based trade (48% in 2020) and global LNG trade (52%) (BP, 2021). Countries are already forging bilateral deals that could pave the way for new hydrogen trade relations (Figure 2.9).
Figure 2.9 An expanding network of hydrogen trade routes, plans and agreements
Map source: Natural Earth, 2021
Notes: Information on this fgure is based on the information contained in government documents at the time of writing.
Disclaimer: This map is provided for illustration purposes only. Boundaries and names shown on this map do not imply any endorsement or acceptance by IRENA.
Hydrogen could alter the global balance of power and bring about shifts in the relative positioning of states and regions in the international system. This chapter identifies front-runners in terms of policy, future hydrogen exporters and emerging technology leaders. It also discusses the position of fossil-fuel producer countries, which could use hydrogen to hedge against some of the transition risks as the world moves towards net zero economies. This chapter also describes how hydrogen could foster the relocation of energy-intensive industries to renewable hot spots, which could become sites of green industrialisation.
3.1 Policy front-runners and leading markets
A growing number of countries and companies are engaged in intense competition for leadership in clean hydrogen technologies. This section discusses three metrics with which to identify policy front-runners and potential leading markets: national hydrogen strategies, investments and projects on the ground.
In 2017, just one country (Japan) had a national hydrogen strategy. Today, more than 30 countries have developed or are preparing hydrogen strategies (Figure 3.1), indicating growing interest in developing clean hydrogen value chains.
Figure 3.1 Hydrogen strategies and those in preparation, October 2021
Disclaimer: This map is provided for illustration purposes only. Boundaries and names shown on this map do not imply any endorsement or acceptance by IRENA.
There is considerable variation in the scope and detail of these strategies. Box 3.1 describes the vision and focus of selected countries and regions that could become early leading markets for hydrogen because of their market size and/or ambitious hydrogen plans. These large markets are well positioned to set standards and other rules of the game if their strategies and plans are operationalised.
BOX 3.1 Early adopters? Hydrogen visions in selected front-runner countries and regions
CHINA: With annual consumption of more than 24 million tonnes, China is the world’s largest user and producer of hydrogen. Production of hydrogen, which is predominantly coal-based, accounts for 3-5% of China’s coal consumption.14 Since 2019, China has had more than 30 green hydrogen projects in the works. Its first hydrogen roadmap, issued in 2016, focused on hydrogen applications in transport (Strategy Advisory Committee of the Technology Roadmap and SAE-China, 2016). With around 8 400 fuel cell electric vehicles (FCEVs) deployed, China has the world’s third-largest FCEV fleet (after the Republic of Korea and United States), and it leads the world in the deployment of fuel cell trucks and buses (IEA, 2021c). In the current Five-Year Plan (2021-2025), hydrogen is one of China’s six industries of the future (CSET, 2021). Although the country does not yet have a national strategy for hydrogen, 16 provinces and cities have launched five-year plans that feature it.
EUROPEAN UNION: The European Union (EU) issued its hydrogen strategy in July 2020. It identified hydrogen as a key priority for achieving the European Green Deal. The strategy focuses on renewable hydrogen. It includes the installation of 40 gigawatts of renewable hydrogen electrolysers in the European Union by 2030 (European Commission, 2020a). The European Union aspires to become the industrial leader in clean hydrogen. To achieve this goal, it launched the Clean Hydrogen Alliance. Some EU countries expect to become large-scale importers of hydrogen; others expect to become exporters or transit hubs.
INDIA: India launched its National Hydrogen Mission in August 2021, with the ambition of becoming “a global hub for green hydrogen production and export”. Prime Minister Narendra Modi considers green hydrogen vital to making a “quantum leap” towards achieving energy independence by 2047 (Recharge News, 2021a). The government is considering making it mandatory for refineries and fertiliser plants to use some green hydrogen. India is the world’s largest ammonia importer, a key input for fertiliser production, with imports of USD 1.27 billion in 2019 (UN Comtrade, 2021).
JAPAN: Japan was the first country to adopt a national hydrogen strategy in 2017. It aims to become the world’s first “hydrogen society”, through widespread use of hydrogen across all sectors of the economy (METI, 2017). Its plan is backed by considerable government investment in hydrogen technologies and infrastructure. In 2020, around USD 670 million was invested in the hydrogen and fuel cell business (Japan Ministry of Environment, 2020), and mobility targets were set for 800 000 FCEV units and 900 hydrogen fuelling stations by 2030 (CSIS, 2021). It is developing long-term supply agreements for hydrogen, like those that spearheaded the liquefied natural gas trade (METI, 2017).
REPUBLIC OF KOREA: The Republic of Korea’s 2019 hydrogen roadmap identified hydrogen as an engine of economic growth and job creation. The country seeks to become a global leader in producing and deploying FCEVs and large-scale stationary fuel cells for power generation (CSIS, 2021). By 2020, around 10 000 passenger FCEVs had been deployed, more than in any other country (E4Tech, 2021). The government aims to increase that number to 200 000 by 2025 as part of the Green New Deal (MOEF, 2020). It also plans to use hydrogen to power 10% of the country’s cities, counties and towns by 2030 and 30% by 2040 (Korea Herald, 2019). The government expects hydrogen to become the country’s largest single energy carrier in 2050, accounting for a third of total energy consumption (Recharge News, 2021b) and is exploring hydrogen imports with various supplier countries, including Australia and Saudi Arabia.
THE UNITED STATES OF AMERICA: The United States is the second-largest consumer and producer of hydrogen in the world, accounting for 13% of global demand. Until 2020, it was the world’s largest FCEV market, led by California, which has supported the sector for almost a decade through the Clean Vehicle Rebate Program. In November 2021, the United States signed the Infrastructure Investment and Jobs Act into law. It dedicates USD 9.5 billion to accelerating the development of clean hydrogen technology. The United States also launched the Hydrogen EarthShot to bolster the development of clean hydrogen projects. It sets an ambitious "111 goal": to reduce the cost of clean hydrogen to USD 1 per 1 kilogramme in 1 decade.
The COVID-19 pandemic has heated up the race for leadership in clean hydrogen, as many countries recognise the importance of hydrogen for addressing the twin challenges of climate change and economic recovery from COVID-19. Significant shares of countries’ stimulus funds have been earmarked for hydrogen projects, bringing hydrogen into the realm of geoeconomic competition.
By early August 2021, governments had allocated at least USD 65 billion in targeted support for clean hydrogen over the next decade, with France, Germany and Japan making the most significant commitments (Figure 3.2). These amounts are sizeable, but they pale in comparison with energy sector subsidies, which amounted to USD 634 billion in 2017, 70% of which supported fossil fuels (IRENA 2020c).
Figure 3.2 Average annual funding potentially available for hydrogen projects, 2021-2030
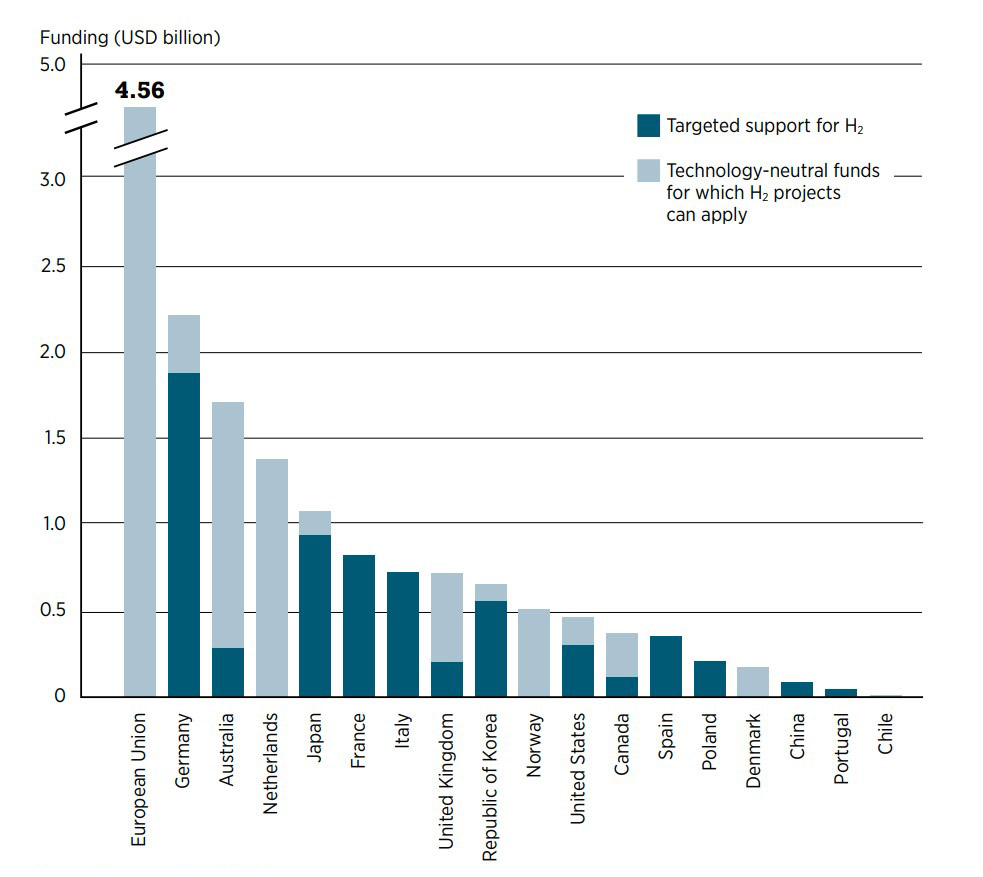
Note: Figure provides a snapshot of support to hydrogen in selected countries as of 5 August 2021. It does not show support mechanisms that have been announced since or are under discussion, such as the hydrogen production tax credit proposed by the United States (US Congress, 2021).
On the back of these national plans and support schemes, investment in clean hydrogen has taken off in recent years (Figure 3.3). As of November 2021, global announcements of hydrogen projects by 2030 add up to USD 160 billion of investment, with half of the investments being planned for green hydrogen production using renewable energy sources and electrolysis (Hydrogen Council, 2021).
Figure 3.3 Clean hydrogen projects and investment as of November 2021
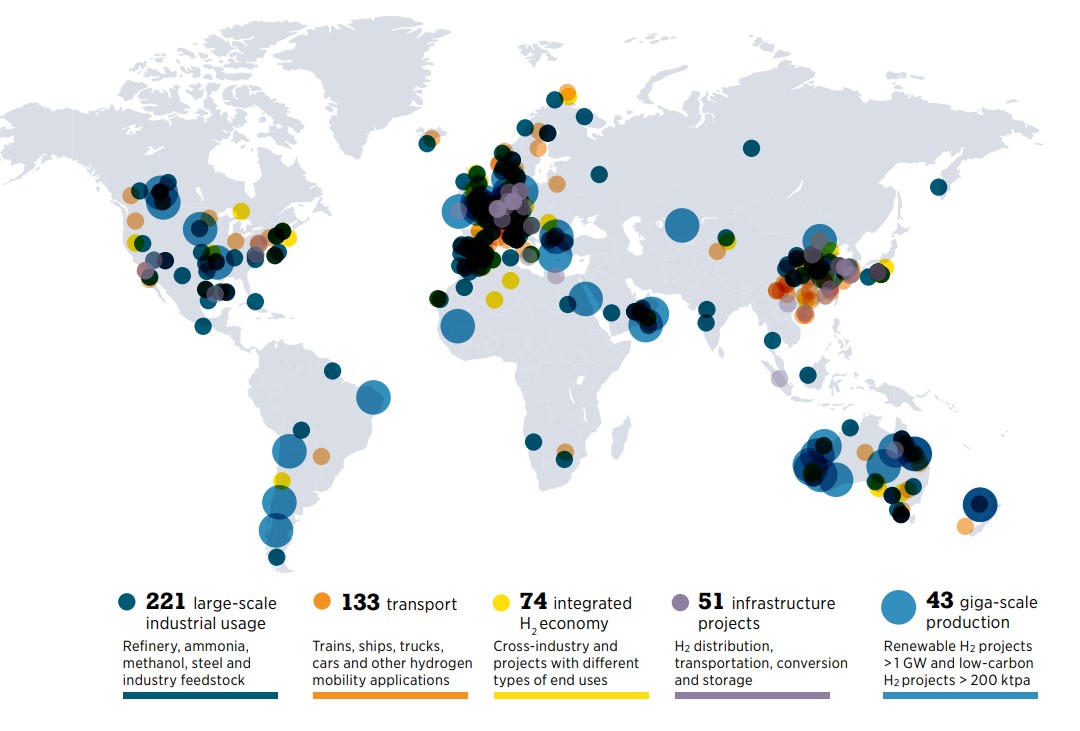
Note: The figure describes large-scale projects only, including commissioning after 2030. It does not include more than 1 000 small-scale projects and project proposals. GW = gigawatt; H2 = hydrogen; ktpa = kilotonnes per annum.
Disclaimer: This map is provided for illustration purposes only. Boundaries shown on this map do not imply any endorsement or acceptance by IRENA.
The pipeline of announced electrolyser projects reached over 260 GW globally by October 2021, and, if implemented, would bring an additional 475 GW of wind and solar PV capacity online by 2030 (IEA 2021d).15 Although this is a dramatic increase from the 0.3 GW of electrolysis that was installed in 2020, it is far from the 160 GW that must be installed on average every year through 2050 to meet the 1.5°C goal (IRENA, 2021a).
With around half of the world’s announced megawatt-scale projects, Europe is surging ahead, driven largely by strong momentum in ambitious decarbonisation policies, national strategies and government support. Europe is followed by Asia (23% of announced projects) and North America (13%). The largest volumes of clean hydrogen are projected to come from Europe and Oceania, which together account for more than half the capacity through 2030, most of which is from renewables. Giga-scale projects have also been announced that focus on hydrogen exports in Africa, Latin America, the Middle East and Oceania (Box 3.2).
BOX 3.2 Hydrogen projects in Africa
Africa’s vast renewable potential, along with its experience with the previous generation of electrolyser from the early 20th century, has drawn the attention of international investors that have announced several green hydrogen projects.
EGYPT and ZIMBABWE already have installed over 100 megawatts (MW) of electrolysers. In December 2021, Egypt announced a new 100 MW project for producing green ammonia.
In May 2021, CWP Global, a renewable development company, signed a memorandum of understanding with the Government of MAURITANIA to develop a 16 gigawatt (GW) electrolysis project, in tandem with 45 GW of renewables. The total cost of the project is expected to be USD 40 billion (Energy Voice, 2021). Mauritania also gave exclusive development rights to Chariot (an oil and gas company active in Brazil, Morocco, and Namibia) to develop up to 10 GW of offshore and onshore wind for green hydrogen production, a project that could spearhead Africa’s first offshore wind farm (Recharge News, 2021c).
At COP26, the Government of NAMIBIA announced the selection of HYPHEN Hydrogen Energy as the preferred bidder for a green hydrogen project. The first phase of the project would bring 2 GW of renewable-electricity generation capacity, along with the electrolyser capacity to produce green hydrogen for conversion into ammonia. Further expansion phases in the late 2020s would raise the total investment value to USD 9.4 billion, which is almost in line with Namibia’s current GDP. Once complete, the integrated facility would have a renewable generation capacity of 5 GW and an electrolyser capacity of 3 GW, with surplus electricity capacity to be fed into the Namibian grid and potentially into the regional power pool. The project will use desalinated water, part of which will be supplied to communities in nearby Luderitz (Engineering News, 2021).
3.2 A new class of energy exporters
Countries and regions with high renewable potential and a low levelised cost of electricity can use their resources to become major producers of green hydrogen. The ability of different regions to produce large volumes of low-cost green hydrogen varies widely. Africa, the Americas, the Middle East and Oceania are the regions with the highest technical potential; Europe, Northeast Asia and Southeast Asia have fewer resources for producing green hydrogen (Figure 3.4). Countries’ technical renewable potential is not the only factor determining how likely they are to become major producers of green hydrogen. Many other factors come into play, including existing infrastructure and “soft factors” (e.g. government support, business friendliness, political stability) and the current energy mix and industry (e.g. renewable plans, potential demand for hydrogen).
One way to foresee future importers and exporters of green hydrogen is to compare their domestic production potential with their expected hydrogen demand by 2050, and the cost of import.16 Three groups of countries can be identified. The first group includes countries with low cost green hydrogen production that could develop into exporters. They can leverage their renewable markets to attract investments in green hydrogen production. Australia, Chile, Morocco and Spain are among such net hydrogen exporters. The second group includes countries that can become self-sufficient in green hydrogen. These countries have sufficient production potential to cater to their own needs without resorting to imports. It includes China and the United States. The third group includes countries that will need imports to satisfy domestic demand, including Japan, Republic of Korea, and parts of Europe and Latin America.
Of course, this picture can significantly change with investment at scale to develop new renewable markets and hydrogen infrastructure where potentials are abundant but lacking access to technology, know-how and local capabilities.
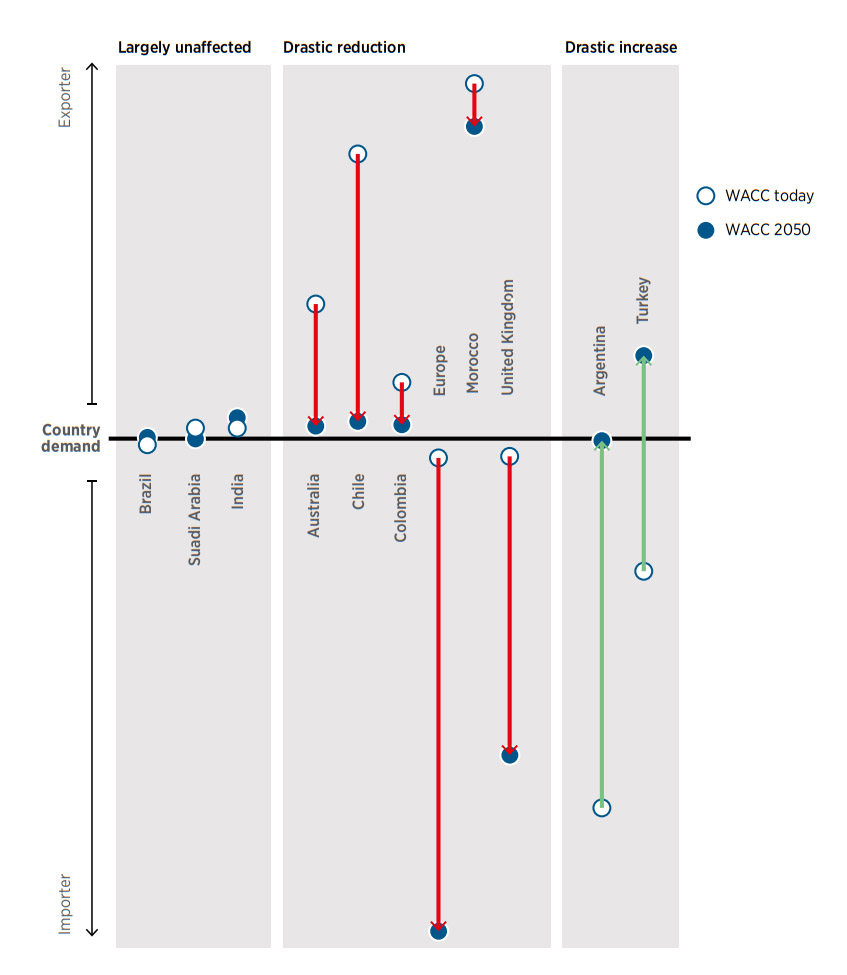
One of the key unknowns is the cost of capital (weighted average cost of capital or WACC), which is currently differing greatly between countries (Box 3.3).
BOX 3.3 The importance of capital cost assumptions for hydrogen trade projections
In a future dominated by renewables, energy cost will be dominated by the capital cost. It is often seen as a prudent approach to assume that the cost of capital differences seen around the world today will persist in 2050 (Egli, Steffen and Schmidt, 2019). However, if one assumes that these differences even out (Bogdanov, 2019), the picture changes completely (Figure 3.5). Latin America, the Middle East and Turkey would become green hydrogen exporters instead of importers, while Spain would move in the opposite direction. The export potential of countries such as Australia and Chile, which already enjoy low WACC today, would be severely diminished, while the import needs of the EU and Germany would rise significantly.
Figure 3.5 Impact of cost assumptions on hydrogen production of selected countries
Experts believe that Australia, Chile, Morocco, Saudi Arabia and the United States are best placed to emerge as major clean hydrogen producers by 2050 (see Figure B.3 in Annex). Some of these countries, namely Australia, Saudi Arabia and the United States, are current energy exporters. They can retain their role as energy exporters, although they will enter a much more competitive market, as green hydrogen can be produced almost anywhere. Other countries, such as Chile, Morocco and Namibia, are currently net energy importers.17 For these countries, a green hydrogen transformation represents a complete reversal of fortune, as ample renewable potential opens new possibilities. Countries that succeed in becoming major exporters of green hydrogen and derived fuels also stand to gain in geostrategic importance (Box 3.4).
BOX 3.4 From energy importer to exporter? Hydrogen activities in selected fossil-fuel importing countries with green hydrogen export potential
CHILE: Chile launched a green hydrogen strategy in 2020. It aims to reach 5 GW of electrolyser capacity by 2025 and 25 GW by 2030, produce the world’s cheapest hydrogen by 2030 and become one of the world’s top three hydrogen fuel exporters by 2040 (Gobierno de Chile, 2020). It is estimated that the country could be exporting USD 30 billion worth of green hydrogen and derivatives by 2030 (Mander, 2020). Hydrogen has attracted growing attention in Latin America, mostly because of the region’s high renewables potential. Several countries in the region have either published or are preparing national hydrogen strategies and roadmaps (Figure 3.1).
MOROCCO: Morocco created a National Hydrogen Commission in 2019 and published a green hydrogen roadmap in January 2021. Hydrogen is mentioned as a key growth sector in the national economy. By 2030, the country envisages a local hydrogen market of 4 terawatt hours (TWh) and an export market of 10 TWh, which, taken together, would require the construction of 6 GW of new renewable capacity and support the creation of more than 15 000 direct and indirect jobs (MEM, 2021).
NAMIBIA: The country’s vast solar and wind energy resources have attracted attention from investors. The government identified green hydrogen and green ammonia as emerging export opportunities (Government of Namibia, 2021). It set up a national Green Hydrogen Council and appointed a special green hydrogen commissioner. The government is also looking into setting up a blade manufacturing plant for wind turbines, a green steel plant and an ammonia fertiliser production line (Weidlich, 2021). The size of these proposed projects is very large relative to Namibia’s economy, pointing to the transformative potential of green hydrogen for the national economy (Geingob, 2021).
3.3 Transition pathway for fossil fuel producers
The energy transition will significantly affect fossil fuel producers: It is highly likely that large parts of oil, gas and coal reserves will never be extracted and monetised. A foreshadowing of these effects was evident during the COVID-19 pandemic in 2020, when lower prices and collapsing demand wiped out around a quarter of the value of all oil and gas reserves (IEA, 2020). Although low-cost producers may see an increase in their market share as the energy transition progresses, even they would see large declines in revenues as the overall market is expected to shrink (IEA, 2021a). Several oil and gas producers have already seen their sovereign credit ratings downgraded. The 20 countries with the highest net fossil fuel exports to Gross domestic product (GDP) ratio (Figure 3.6) suffered a median net downgrade of 1.6 notches in their credit ratings between 2015 and 2020 (Fitchratings, 2021). As decarbonisation progresses, producer countries will have to move their economies away from a reliance on oil and gas.
Figure 3.6 Stranded asset risk for major net fossil fuel exporters, 2019
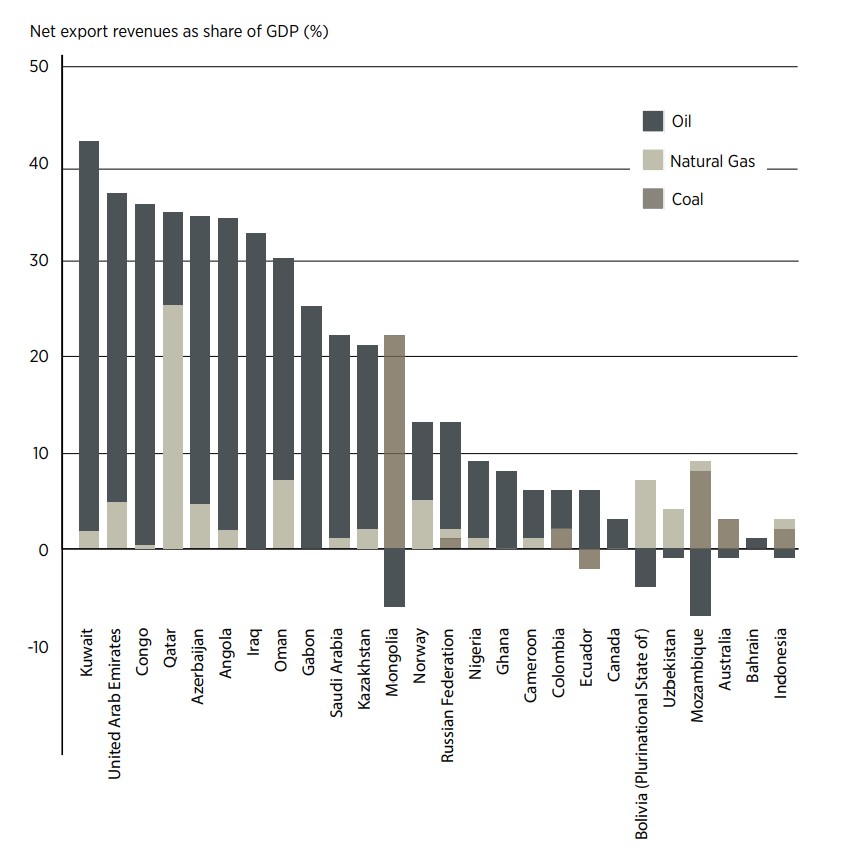
Note: The price of Brent crude oil (the international benchmark) averaged USD 64 per barrel in 2019. Its average in 2010-2020 was USD 76.2 per barrel (EIA, n.d.).
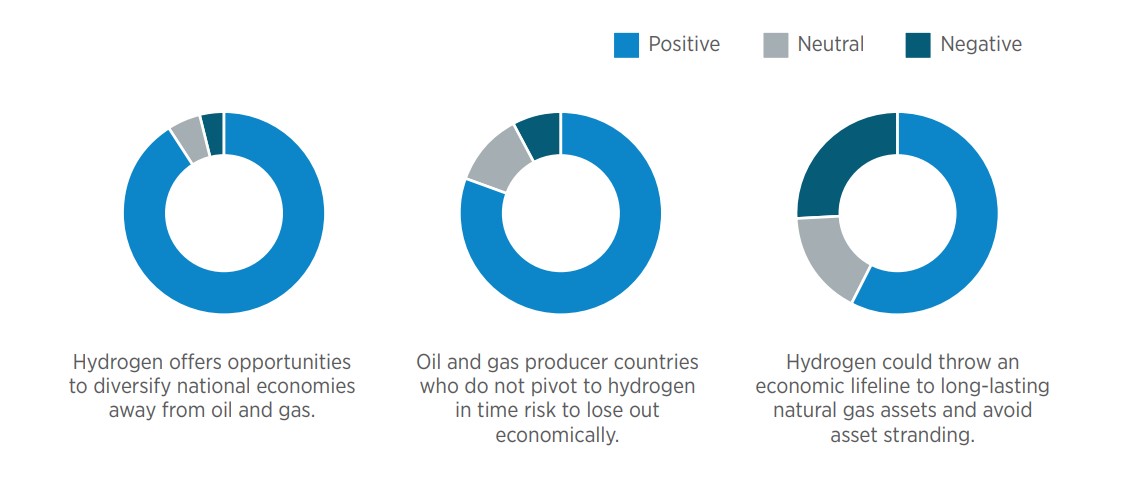
Clean hydrogen offers an attractive transition pathway for oil- and gas-exporting countries to diversify their economies as major export markets move towards low- and zero-carbon fuels and energy carriers (Figure 3.7). Oil- and gas-producing countries are well placed to pivot to hydrogen, as they can leverage established energy export infrastructure (ports, pipelines and storage facilities); a skilled workforce familiar with producing, converting and handling energy fuels and gases; and existing energy trade relations.
In the run-up to COP26, several exporters adopted a net zero goal, including Australia, Russia, Saudi Arabia and the United Arab Emirates. Clean hydrogen is a vital avenue for achieving these goals. Some fossil-fuel producing countries have already adopted national hydrogen strategies (e.g. Australia, Canada, Colombia, Norway, Russia and the United Kingdom) or are preparing to do so.
The strategies of fossil fuel exporters often mention the opportunity that hydrogen offers to develop new export industries (Box 3.5). Several espouse a “technology-neutral” approach and explicitly include the possibility of blue hydrogen (this is the case for Australia, Canada and Norway, for instance). Australia and Canada provide details of expected or necessary carbon capture rates for hydrogen produced from fossil fuels to be considered “clean”, which they set at or over 90% (Longden et al., 2022).
Figure 3.7 Expert views on hydrogen strategies and impacts for oil and gas producers
BOX 3.5 Pivoting to hydrogen? Hydrogen strategies of selected fossil-fuel exporting countries
AUSTRALIA: Australia aims to become a “major global player” in clean hydrogen production and trade by 2030; it considers hydrogen its “next big export”. By 2030, the country wants to be among the world’s top three exporters of hydrogen to Asian markets (Government of Australia, 2019). The government has invested over USD 1 billion to stimulate the domestic hydrogen industry, including co-sponsoring seven hydrogen hubs (Government of Australia, 2021). Nine gigawatt-scale green hydrogen projects are planned or under development, although the government does not rule out blue hydrogen production. Australia has also forged deals with prospective export markets, such as Germany, Japan, and Singapore.
CANADA: Canada’s strategy identifies new export opportunities and states that the country is well placed to become “a leading global clean fuels exporter” (Government of Canada, 2020). By 2050, it aims to be one of the world’s top three clean hydrogen producers. Although Canada is open to many production pathways, its strategy mentions the need to ultimately transition to an increasing percentage of renewable or zero-emission production methods and refers specifically to the country’s large hydropower capacity.
NORWAY: Norway is a major gas exporter to Europe, delivering around a quarter of Europe’s gas needs, mostly through pipelines. Equinor, a Norwegian energy company, is currently studying the possibility of delivering natural gas to Germany or the Netherlands, where it can be converted into blue hydrogen. The hydrogen would then go to a steel mill in Duisburg, Germany, and the carbon dioxide would be shipped back for storage under the seabed of the Norwegian shelf of the North Sea (Equinor and OGE, 2019).
OMAN: Oman is preparing a national hydrogen strategy with the aim of establishing a hydrogencentric society by 2040. It also plans to become a large-scale exporter of green hydrogen or green ammonia. Several gigawatt-scale projects have already been announced, all capitalising on the abundant solar and wind resources in the al Wusta governorate and eyeing the Arabian sea port of Duqm for exports. The biggest of these projects will be powered by 25 GW of solar and wind (Argus, 2021).
RUSSIA: Russia aims to become one of the world’s largest exporters of clean hydrogen, mainly the blue variant. In the words of Prime Minister Mikhail Mishustin, “hydrogen energy will reduce the risks of losing energy markets” (The Russian Government, 2021). By 2030, Russia aims to account for 20% of the global hydrogen market, which is larger than its current share of the natural gas market (RIA Novosti, 2021). By the middle of the century, Russia foresees exporting up to 50 million tonnes of hydrogen, bringing an additional USD 23-100 billion to the annual budget (Patonia, 2021).
SAUDI ARABIA: In July 2020, the Helios Green Fuel Project was announced, a USD 5 billion green hydrogen and green ammonia plant powered entirely by solar and wind. The plant is expected to start operation in 2025 in the planned megacity of Neom, on the shores of the Red Sea near Saudi Arabia’s borders with Egypt and Jordan (HELIOS, n.d.). Saudi Aramco, the national oil company, acquired a 70% stake in the Saudi Basic Industries Corporation, the world’s third-largest exporter of ammonia (Aramco, 2020a). Saudi Aramco made the first shipment of blue ammonia to Japan in September 2020, for use in power generation (Aramco, 2020b). Saudi Energy Minister Prince Abdulaziz bin Salman said at a press briefing in late 2020 that his country “will not be challenged in its record of being the biggest exporter of hydrogen on earth” (Ratcliffe, El Wardany and Martin, 2020).
UNITED ARAB EMIRATES (UAE): UAE’s hydrogen roadmap, released in November 2021, aims to establish the country as a leader in blue and green hydrogen exports. The ambition is to capture 25% of the global low-carbon hydrogen market by 2030. More than seven projects are already in the works via main stakeholders, including the Abu Dhabi Hydrogen Alliance, which is made up of the Abu Dhabi National Oil Company (ADNOC), the Abu Dhabi state investor Mubadala and the state-owned holding company ADQ. ADNOC has concluded partnerships with countries such as Japan (ADNOC, 2021a), Malaysia (ADNOC, 2021b) and the Republic of Korea (ADNOC, 2021c) to explore options for hydrogen trade, and it has already sold four test cargoes of blue ammonia (Emirates News Agency, 2021).
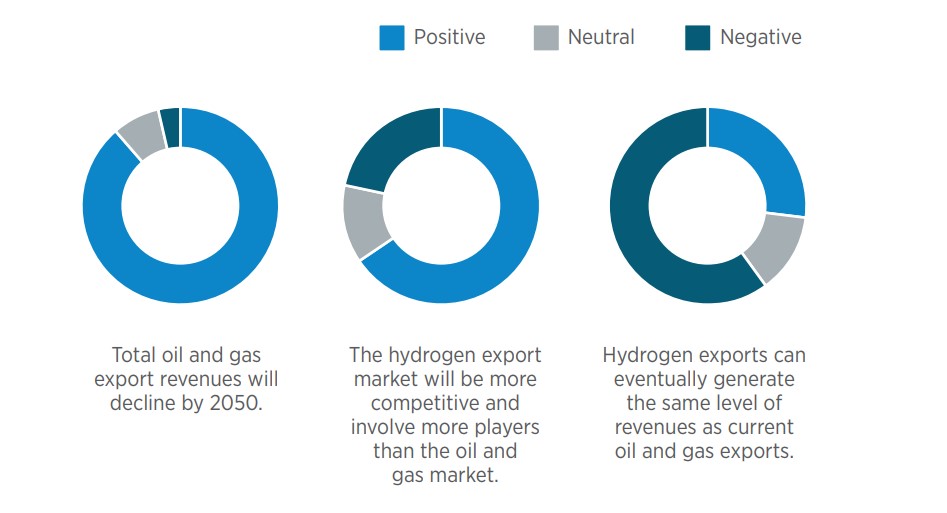
The blue hydrogen production route might appeal to countries with cheap gas reserves. Several oil and gas exporters – including Australia and some of the sunny and windy countries of North Africa and the Persian Gulf – could also become competitive green hydrogen producers. Total oil and gas export revenues are expected to fall significantly by 2050. Although cross-border hydrogen trade might grow significantly, experts doubt that hydrogen will generate as much revenues as oil and gas do today (Figure 3.8). Hydrogen can thus not be considered a new, zero-carbon version of oil. Unlike oil and gas, hydrogen is a conversion business, not an extraction business, which will likely limit the possibilities to capture economic rent (UCL, n.d.). The hydrogen business will be more competitive and involve more players than oil and gas. As the costs of green hydrogen fall, new and diverse participants will enter hydrogen markets.
Figure 3.8 Expert views on future hydrogen revenues and market structure
3.4 Rise of new technology leaders
Over the past few years, zero-carbon solutions have grown more rapidly than expected, giving way to new sources of wealth creation and destruction (Systemiq, 2020). Having a stake in the value chains of climate-safe energy technologies, such as clean hydrogen, can boost a country’s economic competitiveness, national security and energy independence.
Technology leadership might be developed around many aspects of the hydrogen value chain. Among countries that aspire to export hydrogen or derivatives, there is wide variation in technology ownership, which may affect their ability to influence standards and operating frameworks. Australia, Canada and Saudi Arabia, for example, developed hundreds of inventions between 2010 and 2020 (IRENA INSPIRE webtool, 2021). Colombia, Egypt, Morocco, Oman and the United Arab Emirates saw much less activity (with three or fewer hydrogen-related patents filed by each of these countries in this period). In each of the segments of the value chain, countries could play leading roles in multiple ways (see Figure B.8 in Annex). This section focuses on innovation and manufacturing.
Figure 3.9 Technology leadership opportunities in green hydrogen value chains
Note: CO2 = carbon dioxide; N2 = dinitrogen.
Innovation leaders
The landscape of hydrogen technologies and companies is still in flux; renewed policy focus has triggered innovation along the hydrogen value chain. To assess how countries are positioned in the clean hydrogen innovation race, it is useful to look at two metrics: research and development (R&D) spending and patents.
The countries of the Organisation for Economic Co-operation and Development (OECD) have historically accounted for the bulk of global R&D spending in hydrogen, although China is quickly catching up, as evidenced by the government’s six-fold increase in hydrogen R&D expenditure in 2019 (IEA, 2021c). Public funding for hydrogen has been split relatively equally between fuel cells and other applications (IEA, 2021c). If the recent growth in hydrogen R&D is sustained, government support could return to levels not seen since the late 2000s.
The OECD countries account for the vast majority of patents in the field of hydrogen. Japan dominates fuel cell research, holding almost 40% of all patents; Europe leads in hydrogen production (primarily electrolysers) and hydrogen storage technologies (Figure 3.10). Fuel cells account for about 41% of all hydrogen-related patents, but the fastest growth in recent years has been recorded in other areas, such as production and storage. Benefits, such as domestic value added, will depend on where the intellectual property is concentrated.
Figure 3.10 Geographic distribution of hydrogen-related patent families, 2010-2020
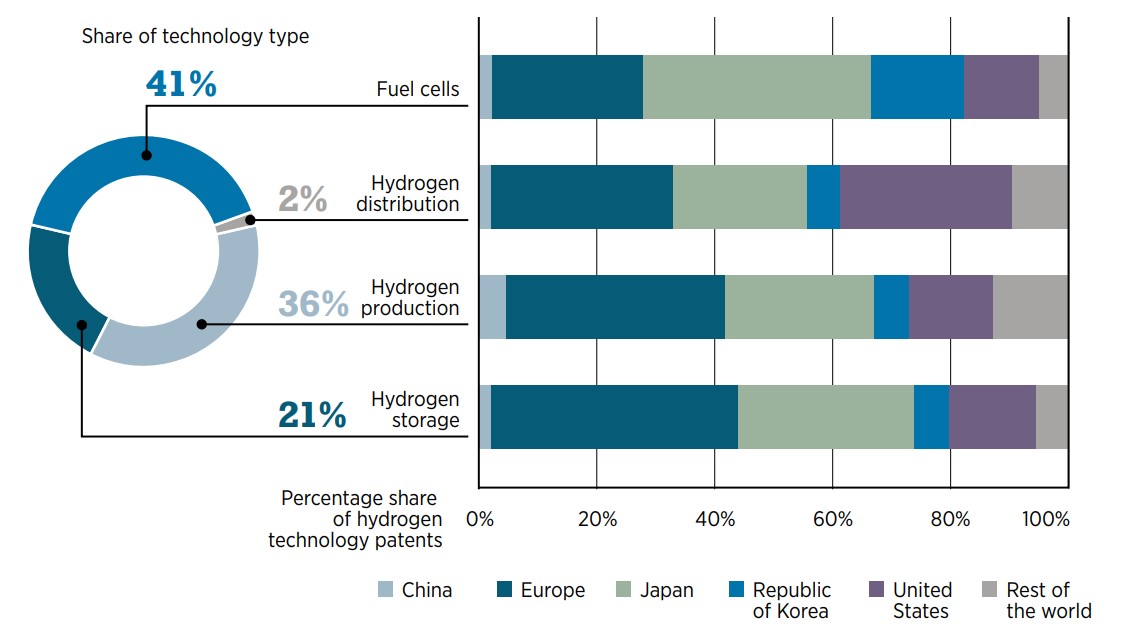
Note: Patent data for 2020 are not complete, because of confidentiality in the early stage of the patenting process. Analysis focuses on the top five players and their patent offices. Patent applications filed at the World Intellectual Property Organization are allocated to the corresponding receiving office. Equal shares are assigned to applicants and patent offices in the patent family. Hydrogen technology is defined based on the subcategory patent codes of the Cooperative Patent Classification that concern the development of enabling technologies for the reduction of greenhouse gas emissions related to energy generation, transmission or distribution – insofar as hydrogen is specifically mentioned (Y02E60/34 Distribution, Y02E60/50 Fuel Cells, Y02E60/36 Production and Y02E60/32 Storage).
Looking at regions where hydrogen-related inventions are protected can give a sense of where technology leaders are looking at commercialisation (Figure 3.11). In 2010-2020, Europe and the United States were the two geographical areas where inventions were highly protected. Most of European inventions (60%) are protected in the European market; the rest are protected in other areas, particularly the United States, where European inventions make up about 20% of all patents. Although Japan developed the largest number of inventions (36% of the total), very few are protected in Japan from abroad, indicating high technology capability but fewer market opportunities. The growing number of international technology partnerships could see Japan emerge as a technology leader, even as a net importer of hydrogen.
China lies at the opposite end of the spectrum: more than 90% of inventions protected by the China National Intellectual Property Administration come from abroad. In the past decade, China has remained an attractive market as a manufacturing hub, a trend that could continue.
Figure 3.11 Flow of inventions in hydrogen technology, 2010-2020
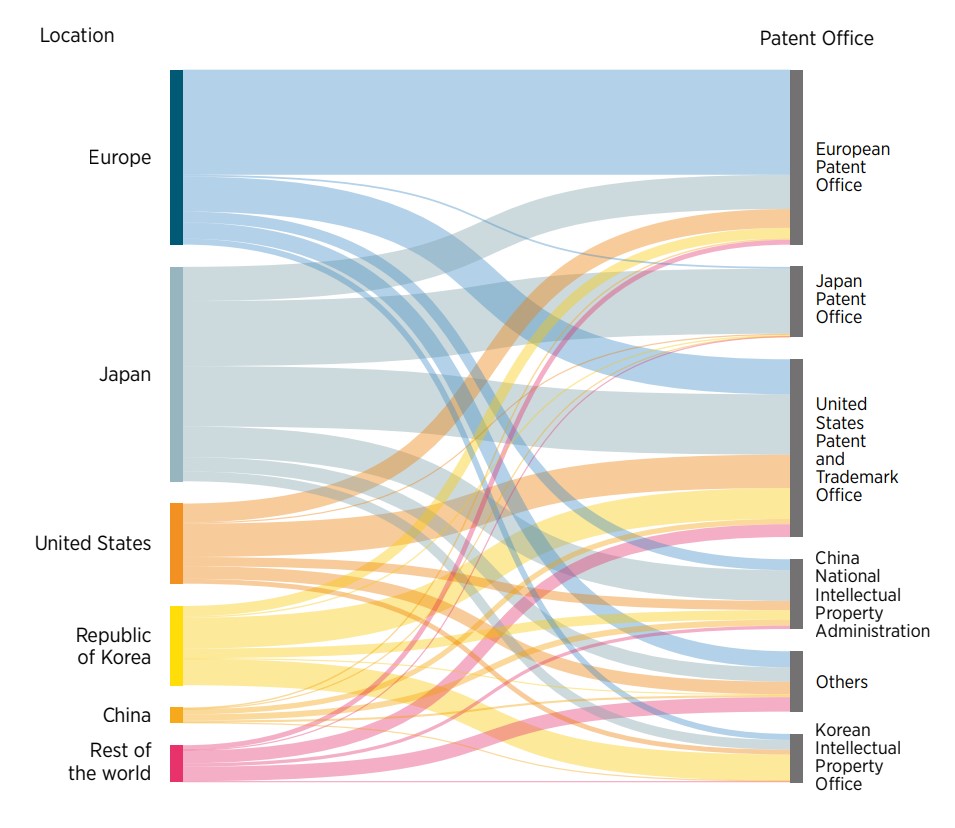
Note: Flow of inventions from country developing hydrogen-related technologies (on the left) to the market where these are protected (on the right side).
More information available at: https://public.tableau.com/app/profile/irena.resource/viz/IRENA_INSPIRE_Hydrogen_Patents/HydrogenTech
Equipment manufacturing
The nascent market for hydrogen-related equipment is highly complex and fragmented. A full discussion of all technologies involved is beyond the scope of this report. This section focuses on the two key hardware pieces in the hydrogen value chain: electrolysers and fuel cells. These two pieces of equipment offer the greatest opportunities for countries and companies to capture value in the coming years and decades and establish themselves as industry leaders. Estimates point to a USD 50-60 billion market potential for electrolysers and a USD 21-25 billion opportunity for fuel cells by the middle of the century (Figure 3.12). These technologies are more mature than technologies in other parts of the value chain. No other aspect of the hydrogen value chain was considered as strategic as electrolysers in IRENA’s expert survey, while fuel cells were deemed essential for technological leadership (see Annex).
Figure 3.12 Estimated market potential for hydrogen equipment and components, 2050
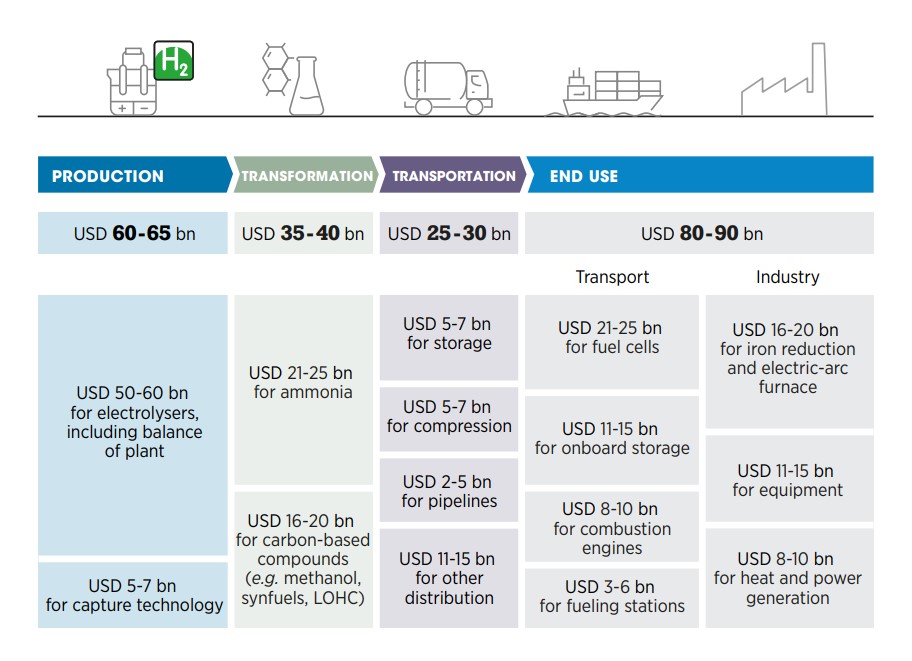
Note: LOHC = Liquid organic hydrogen carrier.
Electrolysers
Electrolysers have been used for decades. Several alkaline water electrolysers with a capacity of more than 100 megawatts (MW) were built during the 20th century (Table 3.1), often near hydropower dams that could provide cheap electricity. Renewable hydrogen was used primarily to produce fertilisers. In fact, until the 1960s, most fertiliser sold in Europe came from hydropower-based electrolysis and ammonia production in Rjukan and Vemork, Norway (Philibert, 2017). Electrolysis was thus crucial for food production.18
Table 3.1 Historic examples of large-scale electrolysis hydrogen production plants
| Plant location (country, city) | Capacity (MW) | Commissioning year |
|---|---|---|
 Norway (Rjukan) Norway (Rjukan)
|
165 | 1929 |
 Canada (Trail) Canada (Trail)
|
90 | 1939 |
|
Norway (Glomfjord)
|
160 | 1953 |
 India (Nangal) India (Nangal)
|
125 | 1958 |
 Peru (Cuzco) Peru (Cuzco)
|
25 | 1958 |
 Egypt (Aswan) Egypt (Aswan)
|
160 | 1960 |
 Zimbabwe (Que Que) Zimbabwe (Que Que)
|
95 | 1974 |
Despite more than 100 years of experience in water electrolysis systems and thousands of installed plants worldwide, by 2014, the industry was described as small and fragmented (FCH JU, 2014). Although the technology is mature, electrolytic hydrogen production was not able to compete with fossil fuels (Godula-Jopek, 2015).
The opportunity offered by the declining cost of renewable electricity and the need to reduce global emissions to net zero are now prompting a renaissance of the electrolyser industry. In 2018, annual global electrolyser manufacturing capacity was about 135 MW (IRENA 2020a). It is projected to rise to 16 GW by 2024 (Figure 3.13). Several gigafactories (factories with gigawatt production capacity) have been announced for large-scale production of electrolysers, including in Australia, France, India, Italy, Norway, Spain and the United Kingdom (IRENA, 2021b; Bullard, 2021; Brisbane Times, 2021; La Repubblica, 2021). Projects of this scale are expected to dramatically reduce the cost of electrolytic hydrogen by achieving economies of scale through mass manufacturing and fully automated production lines.
Figure 3.13 Estimated global electrolyser manufacturing capacity 2021-2024, based on investment plans
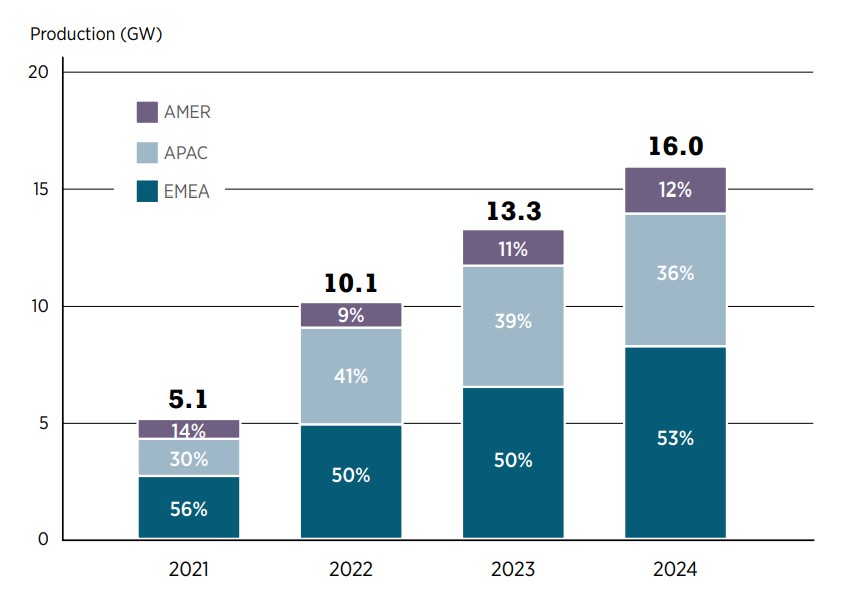
Note: AMER = Americas; APAC = Asia-Pacific; EMEA = Europe, the Middle East and Africa.
Europe has traditionally held a strong position in the electrolyser manufacturing industry. Even today, roughly half of all electrolyser manufacturers are located in Europe, and their component suppliers are mostly European (Fraunhofer ISE, 2020). Europe, the Middle East and Africa (EMEA) are projected to account for half of electrolyser manufacturing capacity in the coming years, based on announced investment plans (see Figure 3.13).19 The European hydrogen strategy is geared explicitly towards maintaining the region’s competitive strengths in electrolyser manufacturing.20 There is a strong desire in Europe to prevent its fledgling hydrogen industry from following the path of the continent’s solar PV industry, an industry in which Europe, particularly Germany, once held a very strong position but which collapsed in the face of cheaper Chinese solar modules (Amelang, 2020).
Although Europe has the largest manufacturing capacity, China is the leader in electrolyser shipments (BloombergNEF, 2021b). Chinese electrolysers are also vastly cheaper than European ones. Chinese manufacturers can reportedly produce standard alkaline electrolysers for USD 300/kilowatt – 75% cheaper than Western-made machines of the same type (BloombergNEF, 2021b). Several, mostly Western, companies are investing in more innovative technologies, such as proton exchange membrane, solid oxide and pressurised alkaline electrolysers. Although more expensive, these technologies have advantages. Proton exchange membrane electrolysers, for instance, are more compact and better suited to operate with variable renewable electricity production than the standard alkaline type.21
Companies in China, Europe and Japan have developed a strong head start in producing and selling electrolysers, but the market is still nascent and relatively small. As hydrogen production plants move from megawatt to gigawatt scale to meet the anticipated boom in demand for clean hydrogen, market shares could shift quickly. Innovation and emerging technologies also have the potential to reshape the electrolyser market and the current manufacturing landscape.
Fuel cells
Fuel cells are devices that electro-chemically convert hydrogen into electricity. They are essentially electrolysers working in reverse: instead of using water and electricity to make hydrogen, they use hydrogen and air to make electricity and water.22 Fuel cells can be deployed in stationary applications (at large-scale power plants, for instance); they can also be used in transport applications, such as fuel cell electric cars, trucks, buses, forklifts, ferries and ships, and aircraft.
Historically, most policy support for hydrogen went to fuel cell electric vehicles and hydrogen refuelling stations (IRENA, 2020b). The cost of automotive fuel cells fell by about 70% between 2008 and 2020 (Kleen and Padgett, 2021), and further cost reductions can be expected if production is scaled up. Global shipments of fuel cells have grown at a relatively modest pace, however. In 2020, 1.3 GW of fuel cells were sold globally. Most of the capacity went into cars, buses and trucks in Asia (Figure 3.14); some 8 000 FCEVs were sold in 2020 (E4Tech, 2021). Although it is the highest number on record, the figure pales compared with the 3 million electric cars sold globally the same year (IEA, 2021e).
Figure 3.14 Fuel cell sales, by region of adoption, 2016-2020
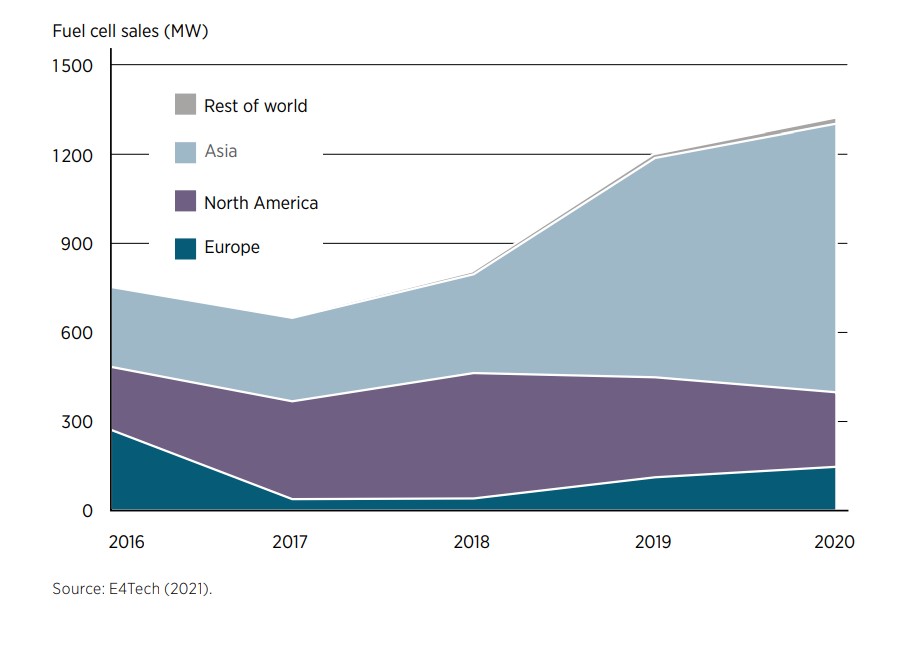
Still, several countries are pushing ahead with fuel cells in many end-use sectors. China aims to have 1 million FCEVs in operation by 2030; Japan has installed 400 000 residential fuel cell systems, with a target of 5.3 million by 2030; the Republic of Korea is targeting to manufacture 15 GW of fuel cells for power generation by 2040 (of which 7 GW is targeted for export); in Europe, a coalition of companies has committed to deploy up to 100 000 hydrogen fuel cell heavy-duty trucks by 2030. California has the official goal of 200 hydrogen refuelling stations by 2025 (CARB, 2019), and vision documents foresee up to 1 000 such stations serving 1 million FCEVs by 2030 (CACFP, 2018).
Compared to electrolysers, the role of fuel cells in the energy transition is still evolving. Innovation in fuel cells might shift markets and attention in the coming years. In any case, the overall scale of the market is likely going to be smaller than that of electrolysers.
3.5 Industrial development in renewables-rich countries
For centuries, access to energy has been one of the major factors deciding the location of industrial activity. From the 12th century Song dynasty in China to England during the Industrial Revolution to the Upper Midwest of the United States in the 20th century, steel industries emerged in locations with access to coal and iron ore (Lovins, 2021b). Coal is bulky, heavy and costly to transport. It was therefore more efficient to produce steel at sites of coal deposits and then transport the steel than to transport coal to the site of steel production (McWilliams and Zachmann, 2021).
Coal-rich areas often attracted wider industries. In the 1770s, Adam Smith observed in The Wealth of Nations that “all over Great Britain, manufacturers have confined themselves principally to the coal countries” (Smith, 1776). One economic historian remarked that “the map of the British Industrial Revolution, it is well known, is simply the map of the coalfields” (Pollard, 1981). It was only the massive fall in freight transport costs since the 19th century that enabled industrial locations to become independent of proximity to natural resources – a phenomenon described as the “death of distance” (Glaeser and Kohlhase, 2004).
The global energy transition will change the sources of energy capture, conversion and distribution. In a net zero future, access to energy will be determined largely by renewable sources of electricity and fuels derived from this input (hydrogen, ammonia, etc.). Whether this shift goes hand in hand with a general industrial relocation to renewables-rich areas hinges on three key factors: location-specific differences in the cost of renewable energy, the cost of transporting energy and the stickiness of existing industrial facilities and agglomerations (McWilliams and Zachmann, 2021).
Many factors drive location choice for industrial production, including human capital, infrastructure and labour costs, but the cost of energy can play a decisive role. For energy-intensive industries such as iron, steel, chemicals, petrochemicals, non-ferrous metals and ceramic materials, the input cost of energy and fossil fuel feedstock represents a major share of total production costs (Moya Rivera and Boulamanti, 2016). As more countries commit to net zero economies and impose carbon-reducing policies such as carbon pricing, the input cost of fossil fuels will rise even more. As a result, many of these industries will need to consider access to low-cost, clean energy to remain competitive.
Although the cost of renewables is falling across the globe, sizeable differences remain across countries and regions. For instance, many developing countries in the tropics have a natural competitive advantage in solar energy.23 Capital costs across regions can differ by a factor of more than three, and the cost of capital can differ by a factor of more than six. As a result, some countries are already enjoying a threeto-one cost advantage in using solar technologies – and the ratio could be much higher for the best locations.24 The cost of transporting renewable energy, whether in the form of electricity or hydrogen, remains relatively high. The cheapest way to transport energy is in materials and products. Thus, renewable potentials create a significant competitive advantage for regions with surplus renewable resources to become sites of green industrialisation.
Relocating industry makes sense where the energy cost reduction exceeds the additional shipping cost. Relocation may benefit commodities such as aluminium, ammonia, iron, jet fuel and methanol (Table 3.2).
Table 3.2 The economics of industrial location choice
|
World production, 2021 (Mt/yr) |
Product price (USD/t) |
Green product price 2030 (USD/t) |
Shipping cost (indicative) (USD/t) |
Energy cost benefit of relocation (USD/t) |
|
|---|---|---|---|---|---|
| Primary aluminium | 65 | 2 500 | 2 500 | 70-100 | 425 |
| Ammonia | 200 | 250-400 | 600 | 100 | 340 |
| Cement | 2 900 | 20 | 100 | 50 | 20 |
| Iron | 1 389 | 300-500 | 400-600 | 15-50 | 115 |
| Jet fuel | 250 | 300-500 | 1 000 | 50 | 600 |
| Methanol | 100 | 410-520 | 600 | 100 | 375 |
| Hydrogen | 120 | 800 | 1 500 | 1 500 | 1 500 |
There are many examples of industrial relocations based on access to cheap energy. Following the oil crises in the 1970s, Japan phased out aluminium smelters and switched to imports. Aluminium smelters are typically situated close to hydropower dams with large amounts of low-cost electricity, in places as diverse as Canada, Iceland, Mozambique, Norway, Russia, Suriname, Tajikistan and Venezuela (Bolivarian Republic of). Ammonia plants have been located close to sources of low-cost natural gas, in Norway, the Middle East and Russia, for example. Renewable ammonia plants are being planned in places with very low-cost wind and solar production, in remote parts of Australia, Chile, Oman and Saudi Arabia, for example (Gielen et al., 2021).
Of course, tomorrow’s locational choices are not made on a blank map, and they depend on more than just cheap energy. Existing industrial clusters and agglomerations are likely to be resistant to change and exhibit path dependency. Most low-carbon steel plants in Europe, for example, are located within existing industrial clusters (McWilliams and Zachmann, 2021). Moreover, countries will want to retain their industrial base while looking for ways to decarbonise polluting industries.
Setting up new production facilities in renewables-rich countries does not necessarily imply the closure of plants elsewhere. On the contrary, in many industries, there is scope for growth. By 2050, around 200 million tonnes per year of expected global steel demand cannot be met by retrofitting existing production sites (Bataille et al., 2021). New opportunities will exist to set up additional clean production facilities in countries with iron ore and cheap renewables.25
In addition, some countries without access to cheap renewables will be able to keep downstream industries, just as countries without oil can have large petrochemical industries. But some energy-intensive industries may relocate to countries with low-cost renewable surpluses, exporting commodities or semi-finished products (direct reduced iron, etc.) for finishing in other countries. Australia, for instance, currently exports iron ore to China’s coal-fired blast furnaces, which produce half the world’s steel (Lovins, 2021b). Given Australia’s massive renewable potential, a case can be made for it shifting from exporting coke and iron ore to exporting direct reduced iron based on renewable hydrogen (Gielen et al., 2020).
Trade, security, and interdependence
As hydrogen becomes an internationally traded commodity, the hydrogen sector will attract growing sums of international investment. Along with these new trade and investment flows will come patterns of global interdependence different from the hydrocarbon-based energy relationships of the 20th century. The shift will change the geography of energy trade. Countries that have not previously traded energy with each other have an opportunity to establish bilateral energy relations centred on hydrogen-related technologies and molecules. As economic relations between countries change, so might their political relations. The advent of an international hydrogen market could well reshape foreign policy and bring shifts in bilateral relations and alliances (Figure 4.1).
Figure 4.1 IRENA Member views on implications of hydrogen on foreign policy by 2030
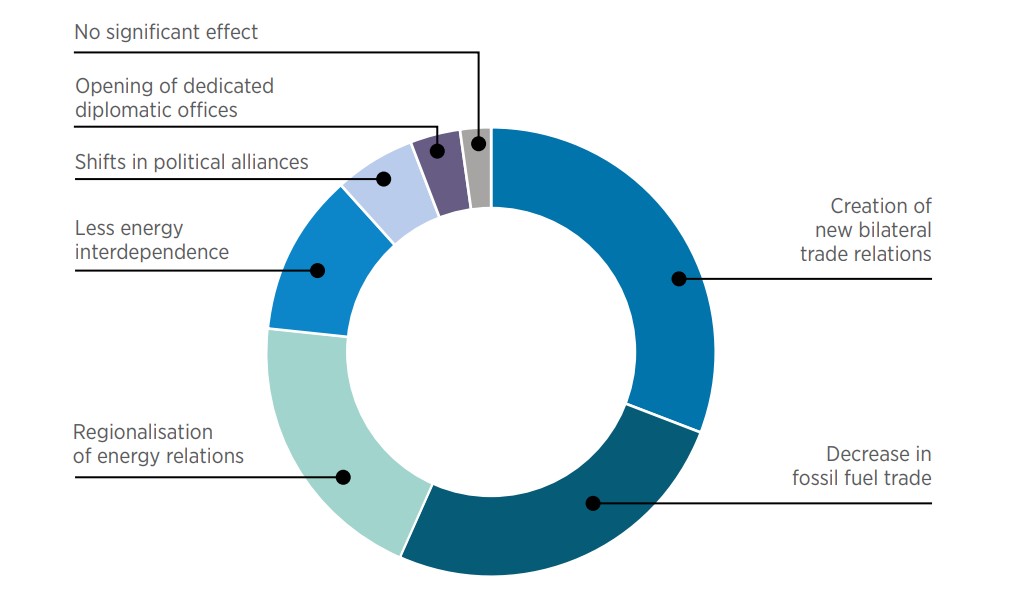
Respondents could select multiple options. Chart shows share of cast votes.
4.1 A new geography of trade
The impact of clean hydrogen on global energy trade needs to be assessed in the context of the broader energy transformation. The shift from fossil fuels to renewables will fundamentally alter the nature and geography of the energy trade. Trade in energy resources will gradually turn to trade in energy technologies and related components and raw materials (IRENA, 2019a). As a result, the value26 of trade in fossil fuels will decline and that in electricity, hydrogen and hydrogen-rich fuels will rise (Figure 4.2).
Energy relations are likely to be regionalised, thereby transforming the geopolitical map. Renewables could be deployed in every country, with renewable electricity exported to neighbouring countries via transmission cables. In addition, clean hydrogen could facilitate the transport of renewable energy over long distances via pipelines and shipping, unlocking previously untapped renewable resources in remote locations. However, driven by transport costs, a dual market for hydrogen is likely to emerge: a regional market, traded through pipelines, and a global market for ammonia, methanol, and other liquid fuels. In other words, hydrogen may well end up being traded in a market that is more diverse and regionalised than oil and gas markets.
Current use of hydrogen is concentrated in industrial coastal zones, where many of the world’s refineries and chemical facilities are located. These ports form ideal springboards to leverage the scale up of clean hydrogen. With time, they could develop into import or export hubs as well as storage sites for bunkering fuels for the maritime sector. These ports and other areas with concentrated activities along the hydrogen value chain (sometimes referred to as “hydrogen valleys”) could, in a later stage, become connected through hydrogen transportation links. The ports could also become the nodes from which a network of hydrogen refuelling stations branches out along major freight corridors.
Some existing natural gas transmission pipelines could be repurposed (with technical modifications) to carry hydrogen. The map of existing natural gas transmission pipelines, as shown in Figure 4.3, suggests where potential cross-border links could remain, even with green hydrogen. Clearly, not all regions are equally covered by natural gas pipelines. The dense networks of pipelines in East Asia, Eurasia, and North America stand in stark contrast with the relatively sparse networks in other continents, and the almost complete absence of such infrastructure in Sub-Saharan Africa. However, Africa’s vast renewable potential opens new opportunities for the continent’s development to a net-zero world (Box 4.1).
BOX 4.1
INFRASTRUCTURE OPPORTUNITIES FOR AFRICA IN THE SHIPPING SECTOR
Africa has vast renewable energy potential that could be used to meet demand from growing sea trade. In 2019, total maritime trade in Africa was 762 million tonnes, representing about 7% of the global total (UNCTAD, 2020). In terms of maritime freight, Nigeria represents almost a third of the activity, followed by Morocco and South Africa. Looking to 2050, higher income, economic growth and a larger population could cause marine freight to grow by more than 11 times current values (Khalili et al., 2019). Even considering energy efficiency and a potential reduction of 45% in ships’ energy consumption (IRENA, 2021d), electricity demand for synthetic fuels could reach 500 TWh. To put this into perspective, Africa’s entire electricity demand in 2019 was about 700 TWh (IEA, 2019b). Higher consumption would require anywhere between100 GW and 350 GW of electrolysis (depending on the type of renewable electricity used) and could trigger an investment of USD 200-400 billion.
Bunkering facilities for new fuels in the shipping sector go together with the transformation of ports and the construction of export facilities. Actions in this direction have already begun. In November 2021, the Namibian Ports Authority signed a memorandum of understanding with the Port of Rotterdam aiming to establish a trading route for green hydrogen. The port aims to import 20 MtH2 by 2050, while Namibia already has plans to develop a 0.3 MtH2 project, starting exports by 2026. The Partners for Growth Programme of the European Union’s Chamber of Commerce and Industry in Southern Africa assessed the potential of hydrogen exports, including potential volumes, costs, and markets (Roos and Wright, 2021). As a result, a feasibility study to assess the potential of Boegoebaai as an export hub for green hydrogen and ammonia was announced in October 2021. This would complement industrial activity in the region and justify the construction of the port, which is currently under assessment.
No decision about energy infrastructure should overlook the fact that the geography of infrastructure in a decarbonised economy could turn out to be very different from what it is today. On the supply side, for instance, the production of renewable hydrogen will likely take place in locations different than today’s oil and gas fields (Muttitt et al., 2021). Conversely, significant electrification of end-uses will reshape demand in size and scope. Every new investment decision is long-lived, so fixed pipeline infrastructure should be assessed with a future-proof logic. For instance, any gas pipeline infrastructure built today should be amenable to “repurposing” to carry clean gases such as hydrogen and biomethane. Such repurposing comes with technical challenges and economic costs, all of which need to be accounted for when planning investments.
Figure 4.3 Global map of natural gas transmission pipelines
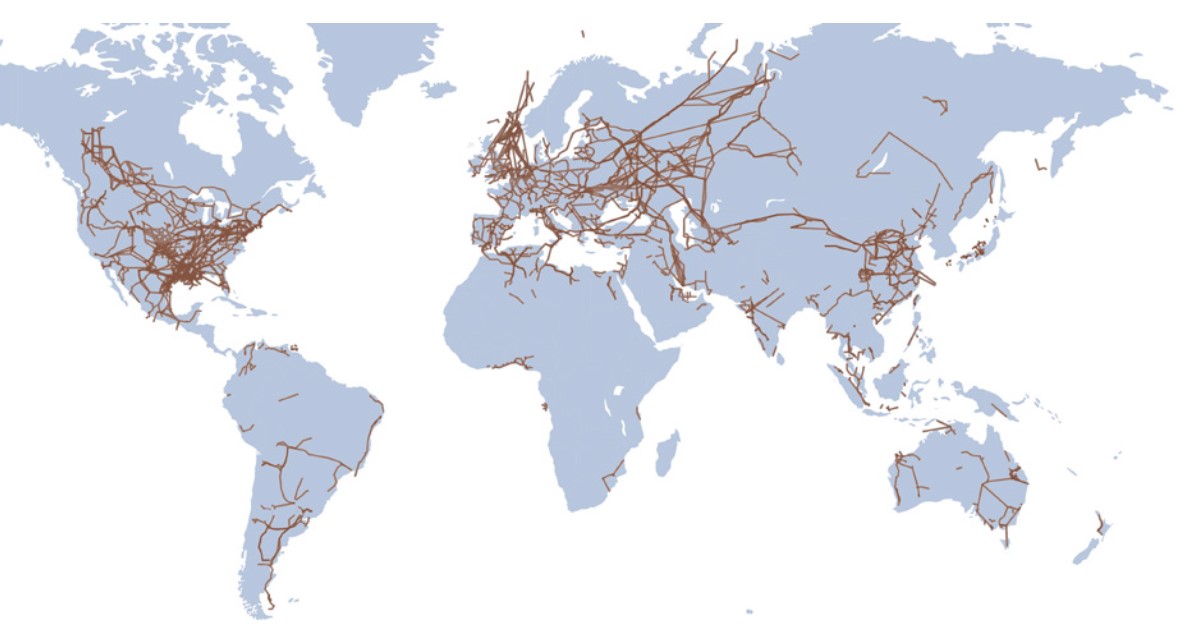
Map source: Natural Earth, 2021
Disclaimer: This map is provided for illustration purposes only. Boundaries shown on this map do not imply any endorsement or acceptance by IRENA.
Hydrogen trade offers opportunities for new regional and cross-regional co-operation. Regional hydrogen trade could be fostered, for example, between Europe and North Africa (van Wijk and Wouters, 2021), between Australia and the Indo-Pacific (Bowen, 2021) or across the African continent (Figure 4.4).
Hydrogen could also shape future maritime trading links. Some companies and governments are already planning international value chains and shipping routes. The world’s first transoceanic shipment of hydrogen took place in December 2019, as a tanker with hydrogen produced in Brunei and converted into methylcyclohexane set sail for the Japanese port of Kawasaki City. In the same month, Kawasaki Industries launched the “Suiso Frontier”, the first dedicated hydrogen tanker for trial shipments of liquid hydrogen from Australia to Japan. In September 2020, the first cargo of hydrogen-derived “blue ammonia” made its way from Saudi Arabia to Japan, where it was used for power
generation27. These trials and demonstration projects suggest the dawning of a new era in energy trade.
4.2 Shaping the rules of the game
Hydrogen will not only alter energy infrastructure and trade flows; it will also require new rules, standards, and governance (Grinschgl, Pepe and Westphal, 2021). Shaping those rules could be an arena for geopolitical competition or international co-operation. Although defining common rules might seem an inherently technical activity, it will help determine the technologies that dominate future markets and reward those who master them. Standards are designed to improve the quality, safety, and interoperability of various goods and services. Divergent standards, however, could fragment markets, stir regulatory competition and erect trade barriers (IRENA 2020b, IRENA, 2021b).
If hydrogen is to contribute to the climate agenda, it is essential to know its carbon footprint and sustainability impact. Certification needs to bring adequate standards of reliability, transparency and independent auditing. This can be achieved through certificates or “guarantees of origin”. While multiple schemes have already emerged in different regions,28 no global standard has yet been established. Moreover, the existing schemes widely differ in how sustainability is defined and where the emission-counting boundaries are drawn along the supply chain (Abad and Dodds, 2020). International co-operation will be essential to ensure consistency in terminology and data to ensure that conversion between certification schemes is transparent and consistent.
Figure 4.4 Possible hydrogen routes across Africa along existing and future trans-African highways
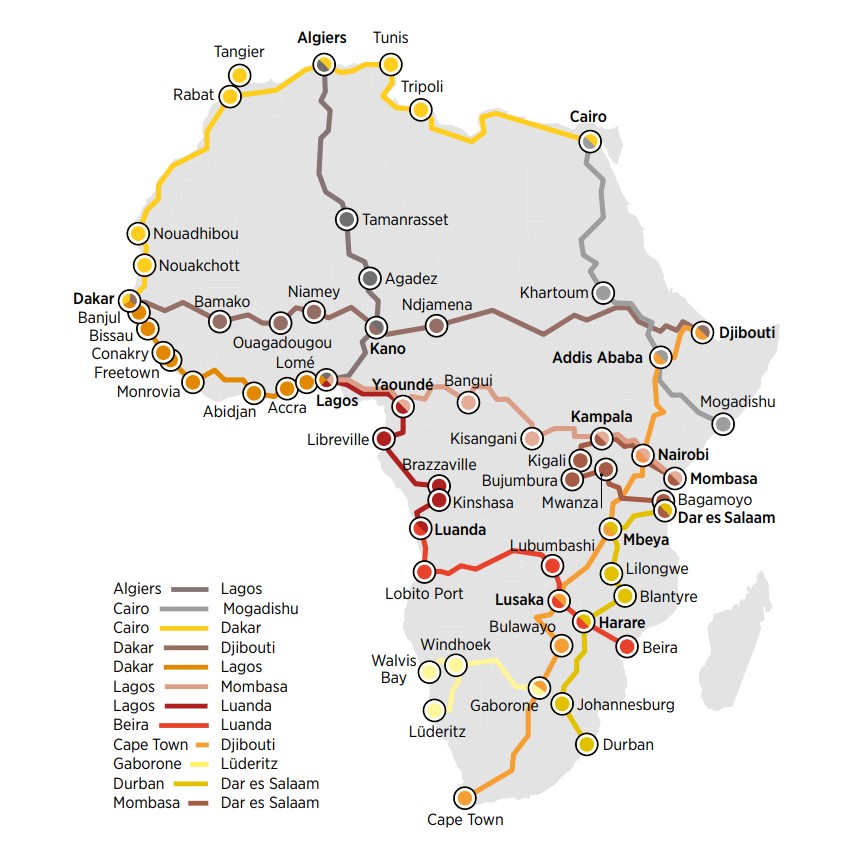
Map source: Natural Earth, 2021
Disclaimer: This map is provided for illustration purposes only. Boundaries and names shown on this map do not imply any endorsement or acceptance by IRENA.
Geopolitical motives loom large in these discussions. Countries have an incentive to set standards to maintain their competitive advantages. For instance, hydrogen certification schemes that cover only emissions generated during production would exclude those that arise during transport and would likely be favoured by producers located far from consumer markets (White et al., 2021). Similarly, countries with large natural gas reserves and transportation systems might be more lenient towards greenhouse gas emission thresholds that favour the blue production pathway or that focus solely on carbon rather than methane emissions. Even if methane emissions are included, countries could influence the methodology or values used to measure them. For example, gas producers could self-report methane emissions along with their production, which could lead to underreporting (Piria et al., 2021).
The currency denomination and pricing mechanism of internationally traded hydrogen are other important aspects. Many unknowns surround both the nature of price discovery in international hydrogen trade(e.g. hubs, benchmarks, pricing mechanisms) and the type of contracts (long-term, take-or-pay or a different model).29 The relevance of the currency used in global indexes is that its use can improve a partys leverage in negotiating deals beyond hydrogen. The chosen currency is positioned as a global benchmark as the market expands. Specifying a currency reduces exposure to import costs away from specific currency pairs. For instance, the European Union, which is likely to become one of the key import markets, is seeking to denominate its future hydrogen imports in euros (European Commission, 2020a). The European Commission strongly believes that such a move would make the Union less susceptible to the effects of the extra-territorial application of unilateral sanctions by third countries (European Commission, 2021).
Putting a price on carbon might be helpful, or even necessary, to make clean hydrogen competitive with grey, and ultimately also with fossil fuels. In that sense, hydrogen may become embroiled in a broader set of carbon trade wars. Strong regulations around upstream methane leakages, for instance, could become a source of friction between blue hydrogen producers and importing regions looking for clean hydrogen. Carbon border adjustment mechanisms, such as the one proposed by the European Union, could cause international friction, as they may hurt trade-exposed, carbon-intensive industries in non-EU countries.30
4.3 Hydrogen diplomacy
As in the early days of the liquefied natural gas (LNG) industry, many governments are forging bilateral deals and agreements to build and operate infrastructure to facilitate cross-border hydrogen trade. These deals range from feasibility studies to letters of intent, memorandums of understanding, energy partnerships, and even trial shipments. Several countries, including Canada, Chile, Germany, Italy, Japan and Spain have explicitly mentioned potential bilateral hydrogen trading relations in their national strategies. Over time, these emerging deals and visions could give way to new energy trade relations, new shipping lanes and new trade routes (Figure 4.5).
Some of these emerging bilateral hydrogen deals involve countries that have an established energy trade relationship. For example, Japan already imports crude oil from Saudi Arabia; both countries are now considering expanding the trading relationship to blue ammonia. However, other bilateral deals do not coincide with existing energy trade flows. This is the case, for instance, with the bilateral deals and conversations between Germany and Morocco, Namibia and the Netherlands, and New Zealand and the Republic of Korea, among others. Whether all these hydrogen trade routes will materialise remains to be seen, but the potential is there for a completely new cartography of energy geopolitics.
Some countries that expect to import hydrogen and related zero-carbon fuels are already engaging in hydrogen diplomacy (Box 4.2). Germany and Japan are trailblazers for forging new hydrogen trade relations, but other countries are following suit. Hydrogen diplomacy may well become a fixture in some countries economic diplomacy.
4.4 Shifts in political relations
Trade and investment relationships between countries are entwined with broader political considerations. Because changes in economic relations can affect political ties (and vice versa), the emergence of markets in hydrogen and other clean fuels could bring about shifts in political relations and alliances between countries.
Trade relations in oil and gas markets have largely been shaped by geology: hydrocarbon reserves are concentrated in a limited number of countries. Meanwhile, 80% of the world’s population lives in countries that are net importers of fossil fuels (IRENA, 2019a). By contrast, every country has renewable resources, although the strength of the wind and the quality of solar irradiance do vary around the world, and other renewables like hydropower or geothermal energy are more prevalent in some locations. Since renewable energy is ubiquitous, countries may gain the flexibility to choose preferred trading partners in the clean fuel markets of the future (Grimm and Westphal, 2021). However, the ability of countries to turn renewable potential into energy production depends on their industrial capacities and on the intellectual property underpinning innovation in the renewables sector. These capacities are relatively concentrated in a few countries. By implication, most countries are dependent on imports of PV panels, wind turbines, and other equipment from a relatively small set of countries. Therefore, trade relations in renewable energy are, to a large extent, shaped by national industrial policies. In addition, corporate strategies select certain countries as regional or global supply hubs.
BOX 4.2
THE EMERGENCE OF HYDROGEN DIPLOMACY
Several countries are already pursuing diplomatic avenues to advance their hydrogen strategies.
Germany has concluded bilateral hydrogen deals with a wide range of potential supplier countries, including Australia, Chile, Morocco, Namibia, Tunisia and Ukraine. The German Federal Foreign Office is setting up dedicated hydrogen diplomacy offices linked to its embassies in Luanda (Angola), Abuja (Nigeria), Moscow (Russia), Riyadh (Saudi Arabia) and Kiev (Ukraine). Through these new offices, Germany intends to support international dialogue on the geopolitical implications of a global hydrogen market. Germany has also allocated nearly a billion euros to the H2Global Foundation, a body set up by sixteen major players in German industry to encourage a quick market ramp-up for green hydrogen and its derivatives. The H2Global Foundation is tasked with buying green hydrogen or hydrogen derivatives abroad and re-selling these products at annual auctions. The funds will be used to make up the difference between the purchase and domestic sales price of hydrogen derivatives.31
Japan’s diplomats and industrial stakeholders are engaging Australia, Brunei, Norway, Saudi Arabia and others about setting up value chains for hydrogen trade. Japan’s international hydrogen strategy aims to secure new import flows of green fuels to compete with LNG in power generation and gasoline in transport. A complementary aim is to sell Japanese low-carbon technologies and know-how overseas (Nagashima, 2018).
Other countries are following suit. The Netherlands was the first country to appoint a dedicated hydrogen envoy (2019-2021). The Dutch government is targeting Chile, Namibia, Portugal and Uruguay, among others, as potential suppliers. The Republic of Korea has concluded agreements with Saudi Arabia and New Zealand. Industrial players in Belgium are looking to Chile, Namibia, and Oman for large-scale hydrogen imports, while Singapore is studying the viability of hydrogen supply routes from Latin America. These emerging bilateral deals are part of a global race for the best sites to produce hydrogen (Radowitz, 2021).
Hydrogen diplomacy cuts two ways, with exporters seeking and finding potential customers. Chile’s national hydrogen strategy, for instance, mentions that it will deploy “green hydrogen diplomacy” to position itself internationally as a source of clean fuels and energy carriers. It notes that it will leverage its participation in international platforms and its “diplomatic relations with 171 states” to unlock its hydrogen export potential and attract foreign investment (Chilean Ministry of Energy, 2020a). It hosted a green hydrogen summit in 2020 (Chilean Ministry of Energy, 2020b), an example followed in 2021 by Oman, another prospective exporter32.
Hydrogen trade flows may also raise new strategic considerations. As some countries and regions begin to import hydrogen in large quantities, the strategic importance of exporting countries will grow. New hydrogen production centres and shipping routes will also inform strategic planning by security and defence organisations.
Opportunities will arise to shape the nascent hydrogen market to advance sustainable development. Germany, for example, has already engaged several African countries to explore and develop a hydrogen economy that makes use of the continent’s resource potential to support sustainable economic development (H2Atlas, 2021).
From the many countries around the world with good conditions for producing cheap, clean hydrogen, prospective importers can pick those with whom strong ties already exist. They may also opt to use their demand for clean hydrogen to forge new alliances. Geography will still play a role, since not every country can produce low-cost hydrogen for export, and transport costs over long distances are likely to remain significant. Some countries simply lack the resource endowment (renewable potential, space, land, water availability, etc.), while others lack geographic proximity to major demand centres.
In this context, supporting the development of hydrogen industries in developing countries with abundant potential can achieve multiple objectives. Since not all countries have the same ability to develop their renewable energy potential at scale and competitively, or to access technologies that remain concentrated in a limited number of places, establishing hydrogen trade relations could foster co-operation around access to technology, knowledge and capital. It could open new partnership possibilities to set up local value chains, stimulate industries, and create jobs in countries rich in renewables. Thus, clean hydrogen can also be an avenue for greater equity.
The growing interest in clean hydrogen is fostering the creation of international partnerships and networks. New alliances are already springing up across the world in the form of multi-stakeholder partnerships and industrial alliances (Ghosh and Chhabra, 2021). In the longer term, as energy trade flows change, so will security partnerships. The way in which the United States’ shale boom facilitated its partial disengagement from the Middle East might inform some of the changes that will follow from the advance of clean hydrogen. For instance, key oil transit routes like the Strait of Hormuz may become less critical for global energy security, even if they remain relevant for the transport of clean hydrogen, ammonia, and other fuels from the Persian Gulf and the wider Middle East.
4.5 Greater energy security
Hydrogen has often been seen as a potential remedy for energy security concerns. The oil price shocks of the 1970s and the peak oil prices of the early 2000s drove earlier waves of interest in hydrogen – and for good reason. Clean hydrogen could bolster energy security in three major ways: 1) by reducing import dependence, 2) by mitigating price volatility, and 3) by boosting energy system flexibility and resilience. Most of these benefits are associated with green hydrogen, not blue. And many of them arise only when and if the market develops.
Energy security extends beyond availability and affordability to embrace sustainability and equity, as well. For example, schemes to import renewable hydrogen from countries where large parts of the population lack access to electricity or where the grid still relies heavily on fossil fuels may boost the energy security of importers but can hardly be called “green” or “sustainable”. Chapter 5 will dig deeper into the sustainable dimensions of hydrogen.
Energy security also needs to be considered in the context of the physical impacts of climate change. This is not a trifling matter, as energy infrastructure is becoming increasingly vulnerable to climate change. It is estimated that half of the world’s LNG plants, for instance, are exposed to “very high risk” from destructive cyclones, while some 35% of refineries are located in high-risk areas. Many of the world’s LNG plants and refineries are located in coastal areas, heavily exposed to risks from violent storm surges and coastal flooding (IEA, 2021f). While hydrogen could boost fuel diversity and system resilience, hydrogen facilities, particularly those in low-lying coastal areas, could also be vulnerable to the effects of climate change, including storms, floods, and droughts.
Reducing import dependence
Hydrogen can reduce energy import dependence by substituting domestic resources for imported ones. If local wind, solar, hydro, biomass or geothermal energy sources are tapped to produce hydrogen, energy security would rise to the extent imported fuels are displaced. This could help decouple domestic energy consumption from world market vagaries and lower national energy import bills (Steinberger-Wilckens etal., 2017). IRENA’s 1.5°C scenario envisages that two-thirds of green hydrogen production in 2050 will be used locally and not traded across borders (IRENA, forthcoming-a).
If natural gas is used as the feedstock to produce hydrogen, it may extend or even increase imports of natural gas. Non-producer countries that decide to make hydrogen from natural gas could end up importing just as much natural gas via pipelines or LNG terminals as they did before.33 Gas exporters could switch to exporting blue hydrogen directly, of course. From the perspective of importing countries, none of these routes brings significant changes to the energy security equation. Existing import dependencies could be maintained, or increased, through continued dependence on a commodity prone to geopolitical and market volatility.
Mitigating price volatility
Renewable hydrogen may shield large industrial off-takers from the vagaries of fossil fuel price volatility. Fossil fuel markets are notoriously cyclical, and prices can swing substantially over time. These risks were illustrated in the fall and winter of 2021, when gas (and to a lesser extent electricity) prices in various markets across the globe rose to record highs, causing energy-intensive industries, such as fertiliser manufacturing, to temporarily scale back production (Paulsson and Durisin, 2021).
By contrast, renewable-based power is increasingly purchased using long-term power purchase agreements (PPAs) with prices set competitively through auctions. Depending on the strategy of bidders, they may decide to take on the risk of swings in commodity markets by delaying signing purchase agreements with suppliers of components and equipment, or to pass on this risk to the suppliers by signing the agreements at the time of the auction. So far, the falling costs due to the learning curve, technological and process improvement, and economies of scale, have been more significant than fluctuations in commodity prices. As such, bidders have typically placed their bids in anticipation of lower costs and higher profit margins, which means they also take on this risk.34 This makes PPAs an attractive option to reduce exposure to fuel price volatility, not just from commodity swings, but from conflict, accidents or other causes. Expanding the fuel mix with green hydrogen could therefore bring more price stability to sectors such as fertilisers, aviation, and maritime shipping.
That said, the volatility in fossil fuel prices is partially caused by investment cycles in the industry, which sometimes lead to mismatches between supply and demand. This will be the same for green hydrogen or ammonia production, with their fixed assets and high capital intensity. When the supply of green hydrogen is insufficient, there will be a time lag in efforts to increase production capacity.
Improving flexibility and resilience
Hydrogen can also bring flexibility and resilience to an energy system expected to become deeply electrified over the coming decades. Careful planning is necessary to identify the best ways to deploy hydrogen. For instance, electrolysers can be deployed in areas where high shares of energy are produced from variable renewable sources and where excess power cannot be transmitted through power lines or stored in batteries (for example, Northern Chile or offshore wind production in the North Sea) (IRENA, 2021b). While domestic electrolysis targets might advance the goals of energy security and industrial policy, governments would not want to undermine climate mitigation goals or divert focus from other priorities, such as universal access to energy.
Hydrogen’s true competitive strength lies in its unique ability to store energy for long periods of time and in large quantities. As clean hydrogen displaces fossil fuels in some end-uses, hydrogen storage could become increasingly critical to energy security, just like natural gas storage is today in many regions. Yet, there are differences between natural gas and hydrogen storage. Natural gas is stored mostly to meet (seasonal) variation in demand. Hydrogen demand, in contrast, is likely to be more constant, at least in the early years of the hydrogen market scale-up, when the bulk of demand is likely to come from industrial customers (primarily steel, ammonia, and high-value chemicals).35
Hydrogen storage will be needed primarily to meet variation in supply, not demand, as green hydrogen is made with variable renewable energy sources. This could be a reason to locate hydrogen storage close to production rather than demand sites. Locating both production and storage in exporting countries could raise energy security concerns in importing countries lacking buffer capacity to offset potential supply disruptions. The exact location of storage sites will of course also be determined by the availability of suitable underground structures.
Salt caverns are currently considered the most promising option for long-duration storage of hydrogen.36Those now used for natural gas storage can be converted to store pure hydrogen. However, because hydrogen has a lower energy density than natural gas, a retrofitted natural gas storage site can hold only around 24% of the original energy volumes (GIE and Guidehouse, 2021). In other words, four times as much area would be needed to maintain current energy storage capacity. Globally, hydrogen has been stored in only six salt caverns: three in Teesside in the United Kingdom and three in the state of Texas in the United States. Ramping up geological storage of hydrogen calls for careful planning, because some storage sites are likely to be used for storing methane, biomethane, or even CO2 during the transition and possibly in the long term.
Hydrogen can also increase the resilience of remote communities, from villages nestled deep into mountains to islands located far from the mainland. Such communities face unique energy security challenges. They are often highly dependent on external fossil fuels, while their electricity grids are small and often rely on dieselgenerators for back-up power. Yet, remote and island communities have some of the best renewable energy resources in the world (IRENA, 2016a). Here too, hydrogen (often combined with batteries) offers a source of resilience. For instance, on the small Scottish archipelago of the Orkney islands, wind and tidal energy is converted into hydrogen through two water electrolysers. The hydrogen then provides heat and power to local schools, harbour buildings, and several ferries and fuel-cell vehicles (FCH JU, n.d).
4.6 Trade risks and vulnerabilities
Introducing hydrogen as an energy carrier can raise energy security risks, especially when it comes to internationally traded hydrogen and derivatives. Hydrogen is expected to play a smaller role in a decarbonised energy system in 2050 than fossil fuels do presently. Therefore, the level of trade risk would be limited to a smaller number of sectors.. This section discusses three possible vulnerabilities in the global supply chains of hydrogen: 1) country investment risk, 2) technical failures and political disruptions, and 3) access to critical raw materials for hydrogen-related technologies.
Investment risk
Setting up infrastructure for hydrogen trade carries risks on both sides of the supply chain. Given the high capital intensity of hydrogen trade value chains, de-risking these investments will likely require large consortia, high levels of state involvement, and international co-ordination. The history of the LNG market may be instructive in this regard, as Box 4.3 shows.
From the perspective of an exporter, revenue security is crucial. Without an assured stream of revenues, it is not possible to recoup the upfront capital expenses incurred to build hydrogen projects. Revenue must be sufficient to cover the costs of electrolysers (in the case of green hydrogen), natural gas reformers (in the case of blue hydrogen), solar and wind parks (for green hydrogen), gas reserve facilities (for blue hydrogen), and transport and storage infrastructure.
Plans for hydrogen export projects have sprung up across Australia, the Middle East, North and Southern Africa and South America. Together, the plans behind those projects envisage the production of millions of tonnes of clean hydrogen and derivatives destined for global markets. These plans face an uncertain future, as global demand for clean hydrogen is only just emerging and competition for sales will be fierce. The list of countries that aspire to become hydrogen exporters is much longer than those planning imports.
From the perspective of buyers preparing to depend on imports, security of supply is critical. They need to feel confident that sufficient capacities of renewable electricity will be available for electrolysis in hydrogen-exporting countries. Several aspiring hydrogen exporters are facing rising domestic demand for power. Consider the Middle East and North Africa, a region often seen as a potential supplier of hydrogen and derivatives. The population of the region is expected to double between now and 2050 (UN, 2019); electricity demand is expected to surge as a result. This places high demands on renewables, which will be expected simultaneously to meet incremental electricity demand, replace existing fossil fuel generation units and power electrolysers for producing hydrogen for export markets.
Investment uncertainty also imperils energy security. While many gigawatt-scale hydrogen export projects have been announced, they could experience delays owing to several factors, including permitting processes. In June 2021, for instance, Australia’s government rejected on environmental grounds a plan to build the world’s biggest green-energy export project, the so-called Asian Renewable Energy Hub (Smyth, 2021).
Higher investment risks translate into higher overall project finance costs – but they do not necessarily impede investment. The upstream oil and gas sector shows that, if revenues are clear, investment will proceed, even in countries with a high-risk profile. In May 2021, for instance, an Australian developer of renewable energy systems signed a USD 40 billion memorandum of understanding with the government of Mauritania to build one of the biggest green hydrogen projects in the world (Figure 4.6). The agreement was signed even though Mauritania has also received a “high warning” label on the fragile states index (Fund for Peace, 2021).
BOX 4.3
MITIGATING VOLUME AND PRICE RISK IN HYDROGEN TRADE: LESSONS FROM THE DEVELOPMENT OF THE LNG MARKET
Early in its development, the liquefied natural gas (LNG) industry faced the same dilemma as hydrogen exporters do today: how to mitigate the price risk for exporters and the volume risk for buyers. Early supply in those markets went to guaranteed off-takers based on bilateral, long-term contracts (twenty years or more) that had three key characteristics (Energy Charter Secretariat, 2007).
First, they included “take-or-pay” clauses, by which buyers would pay for minimum levels of natural gas regardless of whether or not they would actually need them. Second, the contracts adopted a system of “replacement value” pricing, under which the price of LNG was not based on the cost of production, transportation, profit margin, and so on – but was instead linked to the price of competing fuels (generally oil). Third, the contracts included “destination clauses”, which prevented the buyer from reselling purchased LNG to third parties.
As a result of these conditions, early LNG trade routes were often referred to as “floating pipelines” because they involved dedicated tankers shuttling back-and-forth between specified LNG export and import terminals. This arrangement was a way to share risk; it removed the securityof-supply concerns of the LNG buyer while generating an acceptable return on investment for the LNG seller. In recent years, the LNG trade has become much more flexible, with growth in the use of short-term contracts and spot trading.
Japan played a pioneering role in setting up a traded LNG market. Since its first imports of LNG from Alaska in 1969, Japan was the largest buyer of the fuel (until being overtaken by China in the first half of 2021), and it shaped the structure of the LNG market. Price indexing to the so-called Japan crude cocktail is now a standard fixture of the Asian LNG market, which is by far the largest regional LNG market (Koyama, 2021).
Figure 4.6 The world’s 20 largest announced giga-scale green hydrogen projects
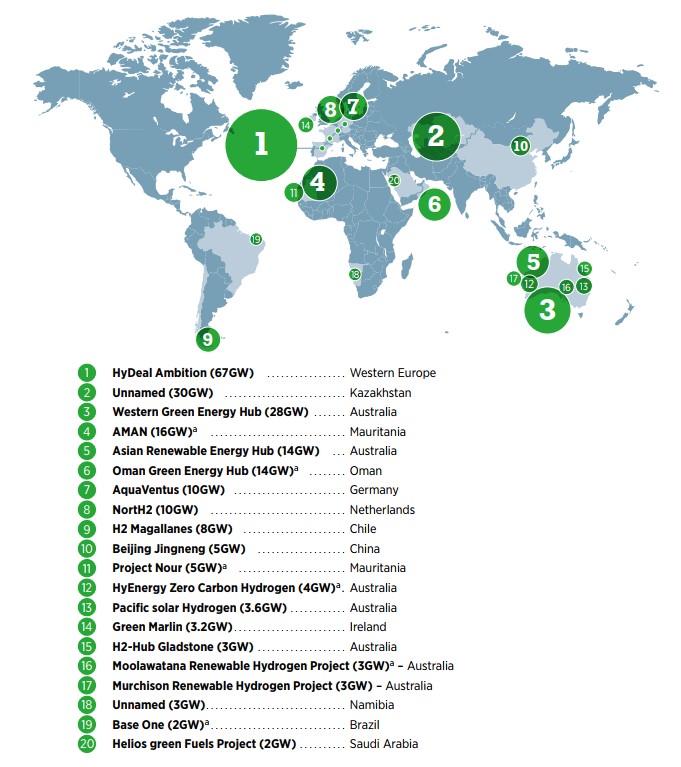
a. Estimated electrolyser capacity based on a comparison with similar-sized schemes.
Disclaimer: This map is provided for illustration purposes only. Boundaries shown on this map do not imply any endorsement or acceptance by IRENA. Map source: Natural Earth, 2021
There are limits to the degree of risk a foreign investor is willing to bear. Countries in turmoil, which may have some of the best potential for hydrogen and derivatives (Ram et al., 2020), are unlikely to tap that potential in the near future because of the immense risks of doing business in the midst of their fragile political and security conditions.
Technical failures and political disruptions
Energy supplies can be disrupted by various types of failures – technical (failures in equipment or infrastructure), human (errors, accidents or malign acts), or natural (hurricanes, earthquakes or floods). The consequences of such disruptions may be more severe in the case of hydrogen infrastructure because hydrogen has unique properties that require special handling for safety.37 However, the safety risks associated with hydrogen are well understood, and national and international standards, protocols and measures can be implemented to mitigate them.
Another form of disruption occurs when states attempt to leverage energy trade and interdependence as a coercive tool for geostrategic purposes. There are multiple historical examples of states manipulating energy flows (export boycotts or import bans), energy prices (discounts to allies) or energy infrastructure (building new oil and gas pipelines) to achieve foreign policy goals (Van de Graaf and Sovacool, 2020). Most such instances of “energy statecraft” have been associated with crude oil and natural gas.
It cannot be ruled out that future hydrogen exports or imports could be successfully instrumentalised for political blackmail or extortion. A precondition for energy statecraft is the existence of asymmetric independence, a situation in which one actor is much more vulnerable to breaking the relationship than the other – for example, because it can quickly resort to other trading partners or because it possesses significant buffers (e.g. emergency stocks) (Keohane and Nye, 2001). In the early days of the international hydrogen trade, the number of trading partners will be limited, and both suppliers and customers are likely to be locked into bilateral, long-term contracts. Any disturbance of imports or exports will be felt hard on the other side owing to the likely absence of a liquid market.
However, it is very unlikely that a hydrogen cartel will emerge similar to historical fossil fuel alliances, such as the Seven Sisters. The preconditions for an effective cartel are that there should be a relatively small number of producers that control a substantial share of the market; they must be able to set and enforce production quotas, control capacity expansion and limit the entry of new producers. Moreover, short-term substitutes for the product in question must be limited. The absence of these conditions has blocked the cartelisation of gas markets (Jaffe and Soligo, 2006). None are likely to be met in the case of hydrogen.
Hydrogen can be produced in many places in the world. It is, in fact, a manufactured product rather than a raw material or energy source. This makes it impossible to deter new entry into the industry, a key condition for cartel formation. Moreover, many countries have stated the ambition to become exporters of hydrogen and derived fuels, limiting the chances of export concentration.
Access to critical raw materials
Raw materials are needed for hydrogen technology (and several other renewable energy technologies) so the discussion also expands to “material security”. Some 30 raw materials are used for fuel cells and hydrogen storage technologies (European Commission, 2020b). While geological supplies of most minerals and metals are presently sufficient, markets are bound to tighten with rapidly rising demand and long lead times in mining and refining projects. Meanwhile, other technologies may come along to compete with hydrogen over available quantities of critical materials. Even if countries are able to produce their own hydrogen and so improve energy independence, they may depend on a limited number of countries for necessary raw materials. Technological innovation, energy efficiency, recycling and circular economy concepts will be critical in alleviating concerns over mineral and metal bottlenecks.
Rapid growth of hydrogen will underpin rising demand for nickel and zirconium for use in electrolysers and platinum-group metals for fuel cells (IEA, 2021g). Because hydrogen will trigger increased deployment of renewable technologies like solar and wind – and because it will go hand in hand with stringing new electric lines and installing batteries – it will also raise demand for the minerals used in those technologies.
Different types of electrolysers and fuel cells have different material requirements. Alkaline electrolysers, which dominate the market today, rely on materials that are generally deemed uncritical, such as steel and nickel (HyTechCycling, 2020). By contrast, polymer-electrolyte membrane electrolysers and solid-oxide electrolysers appear to pose more serious problems of critical material dependence. Platinum and iridium, used in polymer-electrolyte membrane electrolysers, are two of the most scarce and emission-intensive metals in the world. Their supply is also highly concentrated, with South Africa supplying over 70% of global platinum and over 85% of global iridium (Figure 4.7) (Minke et al., 2021). Currently no substitutes for iridium are available or foreseen (Kiemel et al., 2021).
One of the main uses of platinum group metals today is in the automotive industry. Catalysts for internal combustion engines use three such metals – platinum, palladium and rhodium – to limit sulphur dioxide and nitrous oxide emissions. The rise of battery-powered electric vehicles reduces this demand. The platinum industry hopes that the rise of polymer-electrolyte membrane electrolysers and fuel cells could offset lost platinum demand. Solid oxide electrolysers, which are at lab-scale today, but promise efficiencies that could reduce electricity consumption, face even larger concentration of supply; almost 95% of the critical materials used in solid oxide electrolysers come exclusively from China (Figure 4.7) (IRENA, 2020a). The same applies to solid-oxide fuel cells.
It is important to note that the markets for many of these materials are not liquid and are inelastic in the short-term. This means that a relatively small change of supply and demand can result in large price fluctuations. The past 20 years, for instance, have seen prices fluctuate by a factor of four for platinum, a factor of 15 for palladium, and a factor of 70 for iridium (Platinum Matthey, n.d.). These price fluctuations could reverberate through hydrogen supply chains and affect the overall cost of key pieces of equipment, such as electrolysers, while also affecting the revenues for miners and raw material exporters.
Figure 4.7 Top producers of critical materials in electrolysers
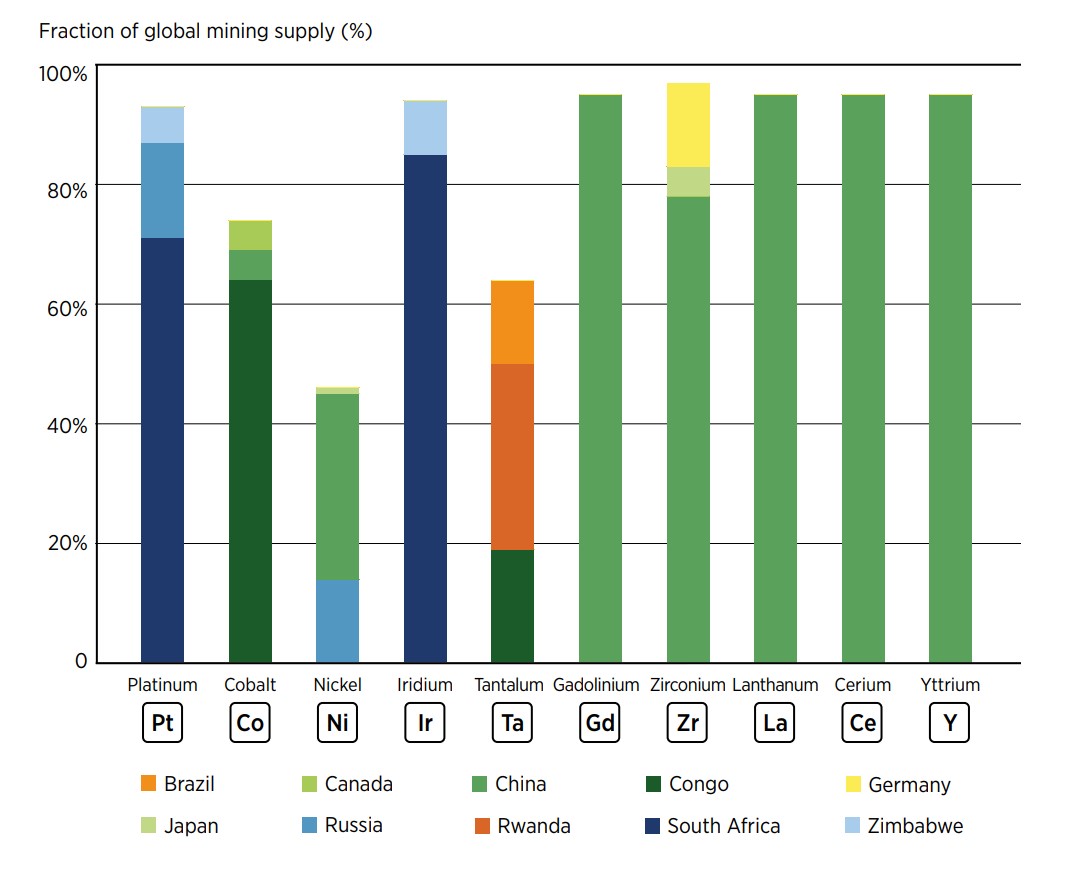
The root causes of geopolitical instability – and hydrogen’s role in addressing them
In today’s interconnected world, accounts of geopolitical change must grapple with the broad and multidimensional nature of global threats and vulnerabilities. The concept of “human security” is often used to describe the root causes of geopolitical instability. Looking beyond military threats to state security, this concept expands the security agenda to include non-traditional threats such as climate change, poverty and disease, which can undermine peace and stability within and between countries. The United Nations General Assembly (2012) has endorsed this principle, which informs the United Nations’ work in areas ranging from peacebuilding to humanitarian assistance and sustainable development.
The 17 Sustainable Development Goals (SDGs) reflect the multidimensional nature of human security. Depending on how it is developed, hydrogen could have both positive and negative effects on sustainable development outcomes (Figure 5.1)
Figure 5.1 Expert views on hydrogen’s impact on selected sustainable development outcomes by 2050
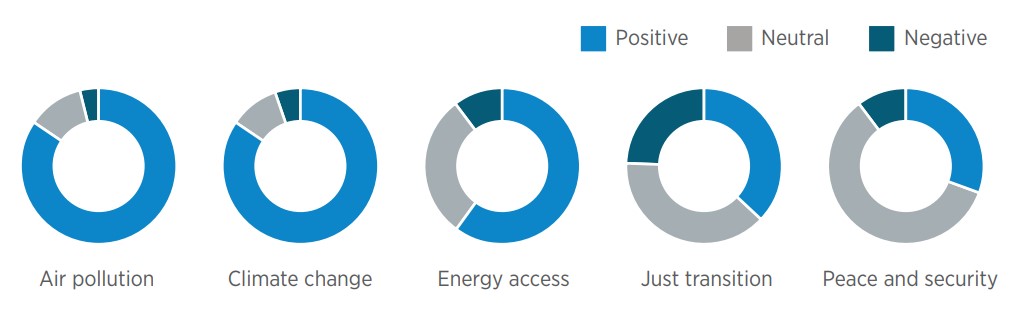
5.1 Socio-political transformations
The global energy transition has social and economic consequences that could have geopolitical ripple effects. To make the energy transition fair and inclusive, policy makers must pay attention to its impact on jobs and industrial development, as well as its inclusiveness. On the one hand, IRENA estimates that electrolysers alone could directly spur the creation of 2 million jobs worldwide from 2030, out of a workforce that is expected to number 137 million by that time (IRENA and ILO, 2021). On the other, hydrogen could be disruptive for certain industries by raising the risk of stranded assets. Blue hydrogen is sometimes portrayed as a safe bet, because it allows producer countries to monetise natural gas resources and pipelines that might otherwise become stranded. But the expected cost reduction in green hydrogen coupled with stricter climate mitigation policies means that investments in supply chains based on fossil fuels (blue or grey) – especially assets expected to be in operation for many years – may end up stranded.
IRENA expects green hydrogen to undercut blue hydrogen on costs by 2030 (IRENA, 2020a). It may do so even sooner in some countries, such as China, thanks to its cheap electrolysers, and Brazil and India, thanks to their inexpensive renewables and relatively high gas prices (Figure 5.2).
Figure 5.1 Countries in which green hydrogen could possibly become cheaper than blue hydrogen, by year
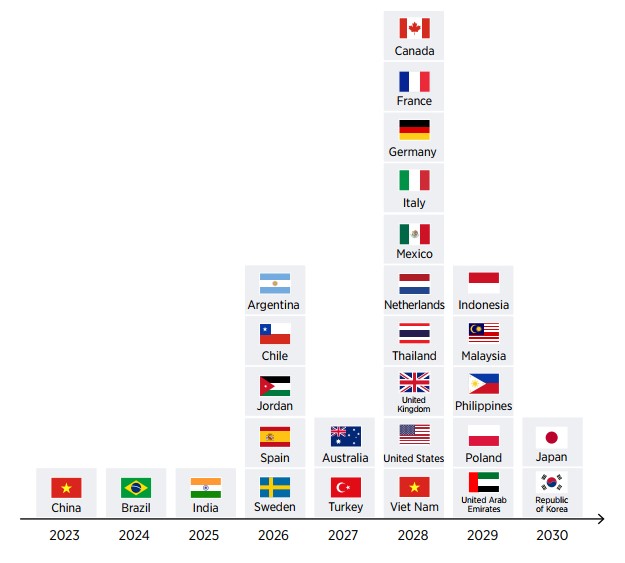
Notes: Figure is based on the optimistic alkaline electrolyser cost scenario of Bloomberg New Energy Finance; one-toone sizing of renewable and electrolyser capacity; and 20-year gas price outlook averages.
Another risk of asset stranding looms at the end-use segment of the hydrogen value chain. Clean hydrogen is expected to play an important role in heavy industries such as steel, cement and chemicals. Existing plants in these sectors have typical lifetimes of 30–40 years, with most undergoing significant refurbishment during their lifetimes (IRENA, 2020b). If new plants and assets are built to operate on fossil fuels, they will lock in billions of tonnes of greenhouse gas emissions and risk becoming stranded in the journey to net zero. With few investment cycles left before 2050, it will be critical to make these plants future-proof.
Collaboration between and among countries will be crucial for the timely dissemination of clean technologies, especially for heavy industry and transport. Assisting developing countries in deploying hydrogen projects could help lock out, rather than lock in, fossil fuels, for example. For their part, industrial countries may be better off replacing ageing infrastructure with net zero compatible solutions designed for the economy of the future.
Hydrogen can also be part of a just transition package and support both industrial development and reconversion, including in energy-intensive industrial parks and ports. For example, Iberdrola, a Spanish multinational electric utility company, has begun constructing a green hydrogen plant for industrial use in Puertollano, Spain, a former coal-mining town (Iberdrola, n.d.). The Port of Rotterdam, presently a major hub for fossil fuels, has outlined a vision to become a hub for clean hydrogen, connecting it to high-voltage cables to offshore wind farms in the North Sea and establishing new trading routes to import hydrogen and derivatives (Port of Rotterdam Authority, 2020).
5.2 Climate change, water stress and food insecurity
Climate-related security risks
For more than a decade, climate change has been widely recognised as a potential “threat multiplier”, exacerbating existing sources of conflict and insecurity (UN General Assembly, 2009). The 2015 report A New Climate for Peace, commissioned by the Group of Seven (G7) (Adelphi et al., 2015) identifies seven compound climate-fragility risks that pose severe threats to the stability of states and societies in the decades ahead (Table 5.1). They range from increased local resource competition and volatile food prices to more insecure livelihoods and migration.
Table 5.1 Seven ways in which climate change threatens stability
| Threat | Description |
|---|---|
| Local resource competition | As pressure on natural resources increases, competition can lead to instability and even violent conflict in the absence of effective dispute resolution. |
| Livelihood insecurity and migration | Climate change will increase the insecurity of people who depend on natural resources for their livelihoods, which could push them to migrate or turn to informal and illegal sources of income. |
| Extreme weather events and disasters | Extreme weather events and disasters will exacerbate fragile situations and can increase people’s vulnerabilities and grievances, especially in countries affected by conflict. |
| Volatile food prices and supplies | Climate change is highly likely to disrupt food production in many regions, increasing prices and market volatility and heightening the risk of protests, rioting and civil conflict. |
| Transboundary water management | Transboundary water management is frequently a source of tension. As demand grows and climate change affects availability and quality, competition over water use will likely increase pressure on existing governance structures. |
| Sea-level rise and coastal degradation | Rising sea levels will threaten the viability of low-lying areas even before they are submerged, leading to social disruption, displacement and migration. In addition, disagreements over maritime boundaries and ocean resources may increase. |
| Unintended effects of climate policies | As climate adaptation and mitigation policies are more broadly implemented, the risks of unintended negative effects will also increase, particularly in fragile contexts. |
Clean hydrogen will be essential to achieving deep decarbonisation and avoiding runaway climate change. By reducing the threats caused by climate change,
it may contribute to geopolitical stability. The need for good policy is particularly relevant in the case of blue hydrogen,
given the risks of methane leakages and the lack of standards on carbon dioxide capture rates.
Hydrogen gas can indirectly contribute to global warming when leaked into the atmosphere, because it increases levels of methane and ozone,
the most harmful greenhouse gases after carbon dioxide.
This effect should not be exaggerated, however. The global warming potential of hydrogen over
100 years is estimated to be less than a fourth that of methane38. Nevertheless, certificates
of origin rooted in a transparent and credible international system will be critical to monitor and manage the contribution of hydrogen to
climate change efforts.
Water stress
Water stress poses a direct threat to human and environmental well-being. It can also drive mass migration and spark conflict. These conflicts can erupt at different levels, from the community level, where local communities may be forced to compete for scarce freshwater reserves, up to the international level, in the form of transborder conflicts (FAO, 2020). Over 2 billion people live in countries experiencing water stress (UNESCO, 2021). The problem is projected to worsen because of climate change, economic patterns and population growth.
Hydrogen requires significant amounts of (pure) water as a feedstock. As the effects of climate change continue to exacerbate water stress, a growing number of countries may need to consider whether hydrogen production is suitable in the longer term. The projected 409 million tonnes of green hydrogen needed by 2050 in IRENA’s 1.5°C pathway would require around 7–9 billion cubic metres (m3) of water a year – less than 0.25% of current freshwater consumption (World Bank, n.d.-c). Moreover, the choice of production path matters, as green hydrogen has a smaller water footprint than blue. Solar PV and wind technologies are significantly less water-intensive than thermal generation during the operational stage, thus freeing up increasingly constrained water resources (IRENA, 2015). For instance, IRENA’s analysis of Nationally Determined Contribution (NDC) commitments of China and India finds that scaling up renewable power, particularly solar PV and wind, combined with improved cooling technologies, could reduce the water withdrawal intensity of electricity generation by 42% and 84% by 2030, respectively (IRENA, 2018b; IRENA, 2016b). In the Gulf Cooperation Council (GCC) region, achieving renewable energy deployment targets and plans by 2030 can reduce water withdrawal for power production and associated fuel extraction by 11.5 trillion litres, a 17% decrease (IRENA, 2019b).
Investors have set their eyes on the locations with the best solar PV and wind resources to develop green hydrogen projects. The catch is that sunnier locations also tend to be the driest. More than 70% of planned electrolyser projects will be in water-stressed regions, such as Australia, Chile, Oman, Saudi Arabia and Spain (Figure 5.4). As a result, over 85% of the planned green hydrogen projects may need to source water via desalination (Rystad, 2021). Desalination of seawater would add USD 0.02–0.05 to the cost of a kilogramme of hydrogen (Blanco, 2021; Caldera and Breyer, 2017). And most commercial-scale desalination today is powered by fossil fuels.
Figure 5.3 Water consumption of hydrogen in 2050 compared with selected sectors today (billion cubic metres)
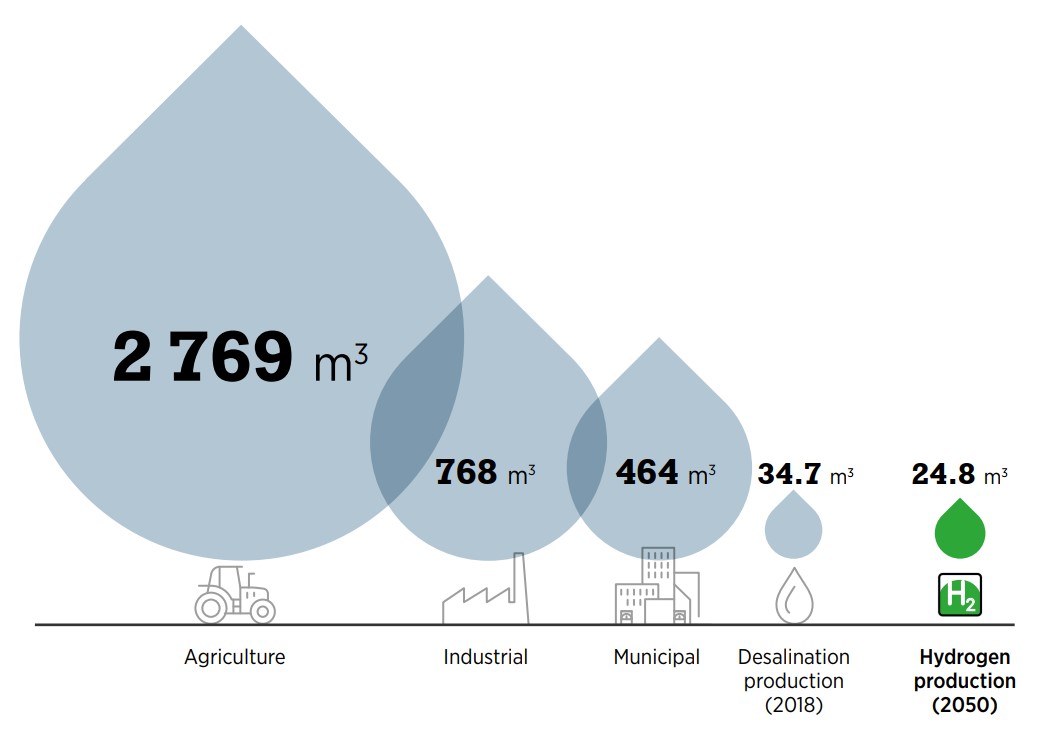
Notes: Figure considers only water consumption, not water withdrawals. Withdrawals cover water that is directly returned to the body of water from which it was taken. Consumption covers any water that is converted into another form or is not returned to the original body. Although most water can be recovered when hydrogen is combusted or used in a fuel cell, it is not generally returned to the original body of water and will be considered to be consumed (Beswick, Oliveira and Yan, 2021).
Green hydrogen can represent an opportunity to improve water security. Desalination can be costly for sectors like agriculture or small industries, making water supply critical. Desalination for green hydrogen adds 1–2% to energy consumption and the cost of production, where the electricity consumed is the determining factor. Thus, green hydrogen could give a spur to the desalination industry, resulting in a massive scale-up of desalination capacity. This could also increase the supply of freshwater for other purposes beyond electrolysis, or drive down the cost of desalination (IRENA, 2020a). It should be noted, however, that desalination plants produce brine enriched with salt and chemicals, so ecological effects could arise from its return to the sea.
Figure 5.4 Heat map of water stress levels
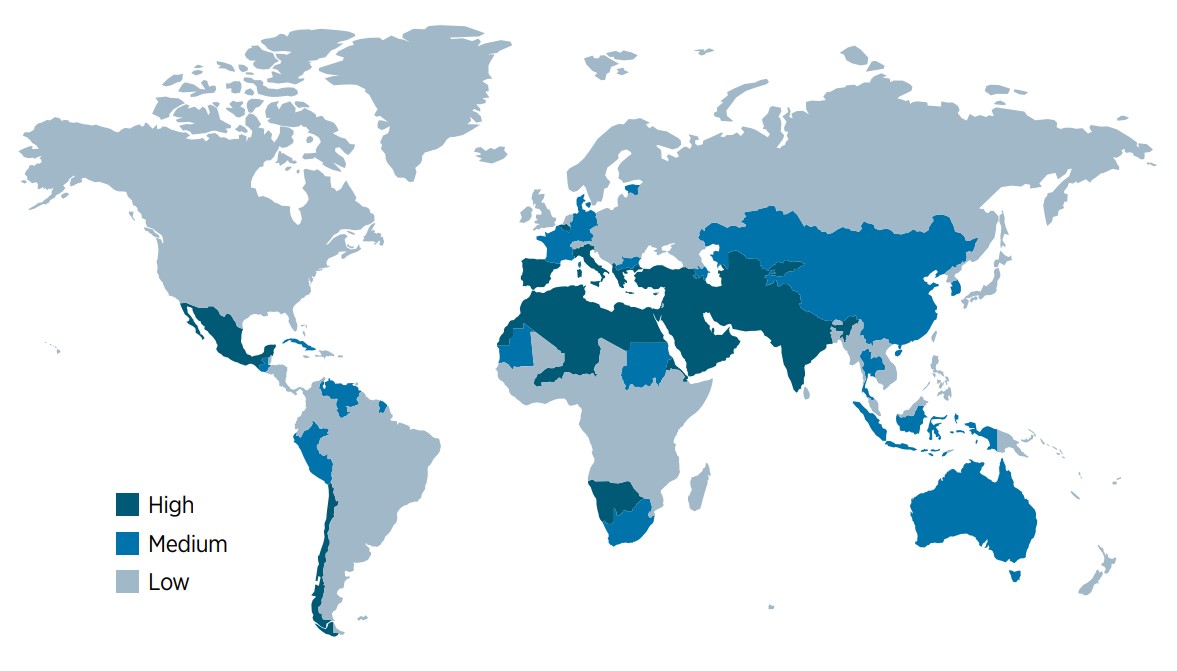
Map source: Natural Earth, 2021
Disclaimer: This map is provided for illustration purposes only. Boundaries shown on this map do not imply any endorsement or acceptance by IRENA.
Conflicts over land and food
Hydrogen is used to produce all of the world’s industrial ammonia. Ammonia is the main ingredient in synthetic fertilisers, which account for a significant part of the world’s crop yields. These hydrogenbased fertilisers now support approximately half the global population (Ritchie, 2017). Without hydrogen, agricultural productivity would plummet, jeopardising food security for millions of people.
Currently, there is no real alternative to using hydrogen to produce synthetic fertiliser, and hydrogen is generally sourced from natural gas and coal, without carbon capture and storage. The expected boom in clean hydrogen could thus contribute to the decarbonisation of the global food supply chain. To the extent that it increases the supply of hydrogen on the market, it could also bolster global food security.
These effects could be especially relevant for Sub-Saharan Africa, where fertiliser consumption was less than 20 kilogrammes per hectare (kg/ha) in 2018 – two to three times less than required to meet the needs of the agricultural sector (World Bank, n.d.-d). Inadequate use of fertiliser results in the depletion of soil nutrients, low agricultural productivity and less arable land per capita. Ammonia on the continent is largely produced from natural gas concentrated in Algeria, Egypt and Nigeria. However, ammonia can also be competitively produced from solar and wind, with projects announced in Egypt, Mauritania, Morocco and Namibia (Box 3.2). Setting priorities is also vital, as domestic needs should be met before countries export ammonia.
The advent of clean hydrogen could also affect global food prices. Imposing green hydrogen quotas on fertiliser producers – as India is planning to do – may help scale up green hydrogen production. The impact on food security should be carefully monitored, however. The cost of natural gas currently represents 60–80% of the variable input costs of producing nitrogen fertilisers (European Commission, 2019). When the price of gas swings, fertiliser prices follow. This effect was on full display in the fall of 2021, when a surge in natural gas prices forced a few fertiliser manufacturers in Europe to scale back their output partially or completely (Thapliyal, 2021).
Regarding the impact on land, there are some limitations on deploying large-scale renewables-based electrolysis installations in certain areas, such as areas with high population densities or competing activities or functions (e.g. agriculture or protected areas). However, the most significant impact on land will come from the vast wind and solar PV farms that need to be built to supply the required amounts of renewable electricity and green hydrogen. One project in Australia, the Western Green Energy Hub, will cover an area of 15 000 km2 – roughly half the size of Belgium or Lesotho – to produce green hydrogen and ammonia for export. The risk of competing land uses can be reduced if renewable installations are developed in unpopulated desert regions and offshore blocks, as is the case with the Nour wind-solar-hydrogen project in Mauritania, which could spur the development of Africa’s first offshore wind farm (Collins, 2021b).
5.3 Hydrogen and the developing world
Many countries have long lived under the assumption that the cheapest and most accessible development route is paved with fossil fuels, particularly coal. Coal supplies over one-third of power globally and plays a key role in industries such as iron and steel. For several rapidly developing countries, coal has been the fuel underpinning growth rates over the past years and decades. In China, for example, coal accounted for 61% of total power generation in 2020, and in India, 71% of the power supply is dependent on coal (Ember, n.d.-a; Ember, n.d.-b). Energy-intensive industries like cement, steel and chemicals remain wedded to fossil fuels.
Over the past decade, the advent of cheaper renewables has begun to challenge the reliance on 20th-century fuels. The falling costs of renewable technologies like solar PV, wind and batteries are opening a new development pathway. Renewables are now the cheapest form of electricity generation, beating 61% of existing coal-fired power plants on cost without financial support in 2020 (IRENA, 2021e; Lovins, 2021a). As a result, the developing world now has a unique chance to leapfrog fossil fuels in the power system. Several countries have already done so or are on the cusp of tilting towards renewables to supply all or nearly all of the growth in electricity demand (Bond et al., 2021).
There is no reason to believe that leapfrogging over fossil fuels will be confined to the electricity sector. For instance, countries and regions can turn directly to electric mobility, as India and Africa have with two- and three-wheeler electric vehicles. Clean hydrogen can expand the suite of options to enable leapfrogging across many sectors.
Many developing countries have decades of experience with hydrogen, if only as a feedstock for ammonia production for fertilisers. A few countries are seizing opportunities to pilot hydrogen projects in new sectors. Indonesia, South Africa, and Trinidad and Tobago are starting to deploy methanol- or ammonia-based fuel cells for telecom towers, often replacing diesel generators for backup systems (Romer, 2011). China, Costa Rica and Malaysia have introduced fuel-cell buses (De Sisternes, Fernando and Jackson, 2020). India is considering mandating refineries and fertiliser plants to use some green hydrogen (Verma, 2021).
Developing countries still need to build up their infrastructure, including roads, houses, schools, factories, sewerage systems and power systems. Doing so requires a great deal of energy and emission-intensive materials, which are often imported. Fulfilling these needs will multiply the benefits of leapfrogging.
Clean hydrogen can offer new industrial opportunities for the production and use of commodities, such as green steel. Even some of the poorest countries in the world may be able to exploit their renewable energy potential to produce green hydrogen locally, generating economic opportunities and increasing energy security. Such potential can be realised only through an international effort to channel resources, share technologies and transfer know-how.
The entire world stands to benefit from the deployment of hydrogen in developing countries and emerging economies if it helps reduce greenhouse gas emissions and contributes to local development and economic growth. Since the turn of the millennium, energy consumption of the developing world has almost doubled; developing countries and emerging economies now account for more than half of global energy demand (BP, 2021),39 even though their per capita consumption is still well below that of developed countries and millions of people in these countries still lack access to basic energy services.
For the time being, however, energy transition technologies are far too expensive for many developing countries. Therefore, the gap between the rich world, which can afford research, development and deployment of clean hydrogen, and the poorer world, which cannot, may increase before it narrows, standing in the way of a fair and just energy transition.
Assisting developing countries – particularly the least developed – to deploy hydrogen technologies early on could prevent the widening of a global decarbonisation divide. Access to (patented) technology, training, capacity building and affordable finance will be key to realising the full potential of hydrogen to decarbonise the global energy system and contribute to equity and stability. This is not only a matter of fairness. A diverse hydrogen market creates new opportunities for trade and co-operation, reducing supply chain risks and improving energy security for all.
Policy considerations and the way forward
The Global Commission on the Geopolitics of Energy Transformation stated in its 2019 report that the world to emerge from the renewable energy transition will be very different from the one built on fossil fuels (IRENA, 2019a). It also noted that the precise scope and pace of the energy transformation could not be predicted. The rise of hydrogen exemplifies this point. A few years ago, hydrogen was considered niche in the global energy discourse. Today, it is a central focus of decarbonisation strategies for harder-to-abate sectors, with a growing number of countries and industries betting on its widespread use.
Many aspects of the energy transition are still evolving. The share of renewable energy is growing, with the resulting systemic changes. Significant electrification of end-use is already reshaping demand in size and scope. The eventual role of hydrogen is yet to be determined, with the bulk of it still produced with fossil fuels. Green hydrogen production is set to thrive, but also in locations other than today’s oil and gas fields. Different economic, social, environmental, and geopolitical implications may emerge, as hydrogen markets develop. Despite many unknowns, hydrogen deployment should make significant inroads by 2030 in a quest for a decarbonised energy system by 2050. Some of the considerations to inform policy making are touched on below.
Hydrogen is part of a much bigger energy transition picture, and its development and deployment strategies should not be pursued in isolation.
Countries should carefully assess how hydrogen fits into their overall economic, social, environmental and political strategies. Among the factors countries must ponder as they strive to position themselves in the new energy economy are the maturity of their energy sector, the current level of economic competitiveness, and the potential socio-economic effects of each choice they make. For example, a country with good renewable energy resources and cheap electricity may well choose to use electrolysis to make green hydrogen cost competitive. In other cases, policy makers may see more value focusing on other technologies underpinning the energy transition (IRENA, 2020b).
The energy transition is diversifying suppliers, supply routes and the types of energy carriers available for import. As a result, plans and investments for infrastructure will have to be carefully assessed, given that these decisions are long-lived and the risks (and costs) of stranded assets are high. Pipeline infrastructure, for example, should be amenable to repurposing to carry green gases such as hydrogen and biomethane. And the technical challenges and economic costs of such repurposing should be accounted for from the outset.
Setting the right priorities for hydrogen use will be essential for its rapid scale-up and long-term contribution to decarbonisation efforts.
Global efforts should focus on the applications that provide the most immediate advantages and enable economies of scale, particularly in the near term. In its early days, hydrogen trade will likely be shaped around bilateral arrangements that carry the risk of default by one or the other party. Prioritising highdemand applications for which hydrogen is clearly the best alternative is more likely to be cost-effective and less susceptible to the risks associated with nascent markets. One example could be supporting and then accelerating a shift to green hydrogen in industrial applications where hydrogen is already used, such as refining and the production of ammonia and methanol (IRENA, 2020b).
The electricity generated from renewable sources for productive uses should be prudently assessed before diverting to produce green hydrogen (IRENA, 2020b). Otherwise, the indiscriminate use of green hydrogen could slow down the energy transition and possibly draw more fossil fuels back into the power mix. Failure to follow the principle of additionality could also impede progress toward expanding access to energy to those who lack it today, if countries prioritise deployment of renewables for green hydrogen export.
International co-operation will be necessary to devise a transparent hydrogen market with coherent standards and norms that contribute to climate change efforts meaningfully.
Clean hydrogen can be an important part of the deep decarbonisation puzzle and, in turn, may contribute to geopolitical stability by expanding positive economic and political opportunities for countries and regions and minimising climate risks and losses. But there are risks of carbon lock-in if hydrogen strategies prolong fossil fuel demand and supply and hinder energy efficiency and electrification. Concerning blue hydrogen, an agreed threshold for carbon capture and methane emissions will be necessary to ensure that blue hydrogen makes a meaningful contribution to decarbonisation.
Transparency in how emissions are determined will be essential for the proper functioning of an international hydrogen market. The success of clean hydrogen markets hinges upon the ability to set coherent and transparent rules, standards and norms to facilitate its deployment across countries, regions and sectors. Shaping these could be an arena for geopolitical competition, but much can be gained with strong international co-operation and constructive political and economic engagement. IRENA provides a useful global umbrella for such co-operation through its Collaborative Framework on Green Hydrogen.
Supporting the advancement of renewable energy and green hydrogen in developing countries is critical for decarbonising the energy system and can contribute to global equity and stability.
A diverse hydrogen market would create new opportunities for trade and co-operation, reduce supply chain risks, and improve energy security for all. The ability of countries to turn renewable potential into energy production depends on the capacity to manufacture needed equipment and the intellectual property that underpins innovation. Presently, the manufacturing capacity is concentrated in a few countries. By implication, most countries depend on equipment imports from a relatively small set of locations. In the interest of geopolitical stability and a just energy transition, future importers should promote diversification by enabling renewable-rich countries in the developing world to set up local value chains and job-creating green industries. Access to technology, training, capacity building and affordable finance will be vital to realising the full potential of hydrogen to decarbonise the global energy system and contribute to global equity and stability.
Geopolitical risks can be mitigated by reducing unnecessary energy consumption across many final uses.
Making the shift to a truly sustainable industry is not simply about switching energy sources, but also about developing efficient ways of using energy fairly and equitably. This involves reducing unnecessary energy consumption across many final uses and changing the system that is based on continuously increasing consumption. For example, in a shift to a decarbonised energy system, countries may well produce hydrogen to improve their energy independence but still depend on a limited number of countries for materials. Innovation, efficiency, recycling, and circular economy can all help alleviate concerns over mineral and metal bottlenecks. But reducing demand will be essential for material security in the long run.
Policy makers should consider broader impacts of hydrogen development on sustainable development to ensure positive, long-lasting outcomes.
The concept of “human security” is often cited as one of the root causes of geopolitical instability. As developed in the 2030 Agenda and the 17 Sustainable Development Goals, the concept expands the security agenda to include threats such as poverty and disease, which can undermine peace and stability within and between countries. Depending on how it is developed, hydrogen could positively or negatively affect sustainable development outcomes. For example, from a technical perspective, water required for hydrogen use is generally not perceived as a barrier to its deployment. However, climate change is multiplying water risks in locations currently seen as promising hydrogen production sites. A greater understanding of the multidimensional nature of global threats and vulnerabilities will make it possible to foresee and defuse certain risks that may come with the deployment of hydrogen on a major scale.
Governments have a unique opportunity today to shape the advent of hydrogen, avoid the flaws and inefficiencies of current systems, and influence geopolitical outcomes. It is evident that increased adoption of hydrogen technologies will disrupt certain economic and political alliances and partnerships. If pursued with due care and caution, this suite of energy technologies also offers the opportunity to demonstrate the positive forces of disruption, enhancing national and regional sovereignty, resilience, and co-operation. Experience from the use of fossil fuels may be instructive as the race for clean hydrogen accelerates. Policy makers can also draw early lessons from trailblazers in the hydrogen sector and replicate their successful practices. Above all, international co-operation will be essential to effectively navigate the unknowns, mitigate risks and overcome obstacles in the years ahead.
References
- Abad, A.V. and P.E. Dodds (2020), "Green hydrogen characterisation initiatives: Definitions, standards, guarantees of origin, and challenges", Energy Policy, Vol. 138, 111300.
- Adelphi, International Alert, Woodrow Wilson International Center for Scholars, and European Union Institute for Security Studies (2015), A New Climate for Peace: Taking Action on Climate and Fragility Risks.
- ADNOC (2021a), "ADNOC and three Japanese companies to explore hydrogen and blue ammonia opportunities", Abu Dhabi National Oil Company, Abu Dhabi, www.adnoc.ae/en/news-and-media/press-releases/2021/adnoc-and-three-japanese-companies-to-explore-hydrogen-and-blue-ammoniaopportunities.
- ADNOC (2021b), “ADNOC and PETRONAS sign comprehensive strategic framework agreement”, Abu Dhabi National Oil Company, Abu Dhabi, www.adnoc.ae/en/news-and-media/press-releases/2021/adnoc-andpetronas-sign-comprehensive-strategic-framework-agreement.
- ADNOC (2021c), “ADNOC and Korea’s GS energy explore opportunities to grow Abu Dhabi’s hydrogen economy and carrier fuel export position”, Abu Dhabi National Oil Company, Abu Dhabi, www.adnoc.ae/en/news-and-media/press-releases/2021/adnoc-and-koreas-gs-energy-explore-opportunities.
- African Hydrogen Partnership (2019), Green African Hydrogen Operational Planning, www.afr-h2-p.com/documents, (accessed 13 January 2022).
- Agora (2021), 12 insights on hydrogen, Agora Energiewende and Agora Industry, www.agora-energiewende.de/en/publications/12-insights-on-hydrogen-publication.
- Amelang, S. (2020), “Europe vies with China for clean hydrogen superpower status”, Clean Energy Wire, www.cleanenergywire.org/news/europe-vies-china-clean-hydrogen-superpower-status.
- Aramco (2020a), “Aramco completes its acquisition of a 70% stake in SABIC from the Public Investment Fund (PIF)”, www.aramco.com/en/news-media/news/2020/saudi-aramco-completes-acquisition-of-70-percentstake-in-sabic.
- Aramco (2020b), “World’s first blue ammonia shipment opens new route to a sustainable future”, www.aramco.com/en/news-media/news/2020/first-blue-ammonia-shipment.
- Amelang, S. (2020), “Europe vies with China for clean hydrogen superpower status”, Clean Energy Wire, www.cleanenergywire.org/news/europe-vies-china-clean-hydrogen-superpower-status>.
- Aramco (2020a), “Aramco completes its acquisition of a 70% stake in SABIC from the Public Investment Fund (PIF)”, www.aramco.com/en/news-media/news/2020/saudi-aramco-completes-acquisition-of-70-percentstake-in-sabic.
- Aramco (2020b), “World’s first blue ammonia shipment opens new route to a sustainable future”, www.aramco.com/en/news-media/news/2020/first-blue-ammonia-shipment.
- Argus (2021), “Oman signs land deal for new green hydrogen plant”, www.argusmedia.com/en/news/2247165-oman-signs-land-deal-for-new-green-hydrogen-plant.
- Atchison, J. (2021), “Ammonia infrastructure: panel wrap-up from the 2020 Ammonia Energy Conference”, 22 January, www.ammoniaenergy.org/articles/ammonia-infrastructure/.
- Bataille, C. et al. (2021), Global Facility Level Net-Zero Steel Pathways: Technical Report on the First Scenariosof the Net-Zero Steel Project, Institute for Sustainable Development and International Relations, Paris, http://netzerosteel.org/wp-content/uploads/pdf/net_zero_steel_report.pdf.
- Bauer, C. et al. (2021), On the climate impacts of blue hydrogen production. https://doi.org/10.33774/CHEMRXIV-2021-HZ0QP.
- Beswick, R.R., A.M. Oliveira and Y. Yan (2021), “Does the green hydrogen economy have a water problem?”, ACS Energy Letters, Vol. 6, No. 9, pp. 3167-3169.
- Black, R. et al. (2021), Taking Stock: A global assessment of net zero targets, Energy & Climate Intelligence Unit and Oxford Net Zero, London.
- Blanco, H. (2021), “Hydrogen production in 2050: How much water will 74 EJ need?” Energy Post, https://energypost.eu/hydrogen-production-in-2050-how-much-water-will-74ej-need/.
- BloombergNEF (2021a), New Energy Outlook 2021, Bloomberg New Energy Finance, London.
- BloombergNEF (2021b), 2H 2021 Hydrogen Market Outlook: China Drives a Gigawatt, Bloomberg New Energy Finance, London.
- BloombergNEF (2021c) Decarbonizing Steel: A Net Zero Pathway, Bloomberg New Energy Finance, London.
- BloombergNEF (2021d), Green Hydrogen to Start Undercutting Blue by Mid-2020s, Bloomberg New Energy Finance, London.
- BMWI (2021), "Minister Altmaier: ’Making further progress on international market ramp-up for green hydrogen’", Federal Ministry for Economic Affairs and Climate Action, Press Release, 14 June, www.bmwi.de/Redaktion/EN/Pressemitteilungen/2021/06/20210614-new-funding-instrument-h2global-launched.html, (accessed 13 January 2022).
- Bogdanov, D., M. Child and C. Breyer (2019), “Reply to ‘Bias in energy system models with uniform cost of capital assumption’”. Nature Communication, Vol. 10, 4587, https://doi.org/10.1038/s41467-019-12469-y.
- Bond, K. et al. (2021), Reach for the sun: The emerging market electricity leapfrog, Carbon Tracker.
- Bowen, J. (2021), Fuelling Cooperation: The Indo-Pacific Hydrogen Transformation, Perth USAsia Center
- BP (2021), Statistical Review of World Energy 2021, BP, London, www.bp.com/content/dam/bp/businesssites/en/global/corporate/pdfs/energy-economics/statistical-review/bp-stats-review-2021-full-report.pdf.
- Brasington, L. (2019), “Hydrogen in China” Cleantech Group, www.cleantech.com/hydrogen-in-china/.
- Brisbane Times (2021), “Fortescue unveils plan for world-leading green hydrogen hub in Qld”, 10 October, www.brisbanetimes.com.au/ (subscription required).
- Bullard, N. (2021), “A gigafactory for hydrogen could be a game changer”, Bloomberg, www.bloomberg.com/news/articles/2021-07-01/a-gigafactory-for-hydrogen-could-be-a-game-changer, (subscription required).
- CAFCP (2018), The California Fuel Cell Revolution, California Fuel Cell Partnership, July, p. 24.
- Caglayan, D.G. et al. (2020), “Technical potential of salt caverns for hydrogen storage in Europe”, International Journal of Hydrogen Energy, Vol. 45, No.11, pp. 6793-6805.
- Caldera, U., and C. Breyer (2017), “Learning curve for seawater reverse osmosis desalination plants: Capital cost trend of the past, present, and future”, Water Resources Research, Vol. 53, No. 12, pp. 10523-10538.
- CARB (2019), 2019 Annual Evaluation of Fuel Cell Electric Vehicle Deployment & Hydrogen Fuel Station Network Development, California Air Resources Board, July, p. 89.
- Chilean Ministry of Energy (2020a), National Green Hydrogen Strategy, Government of Chile, Santiago, https://energia.gob.cl/sites/default/files/national_green_hydrogen_strategy_-_chile.pdf.
- Chilean Ministry of Energy (2020b), “Chile 2020: Green Hydrogen Summit – Highlights”, Government of Chile, Santiago, https://energia.gob.cl/sites/default/files/giz_green_hydrogen_summit.pdf.
- Collins, L. (2021a), “Green hydrogen now cheaper to produce than grey H2 across Europe due to high fossil gas prices”, Recharge, www.rechargenews.com/energy-transition/green-hydrogen-now-cheaper-to-producethan-grey-h2-across-europe-due-to-high-fossil-gas-prices/2-1-1098104.
- Collins, L. (2021b), “New 10GW green hydrogen project in Mauritania could include Africa’s first offshore wind farm”, Recharge, www.rechargenews.com/energy-transition/new-10gw-green-hydrogen-project-inmauritania-could-include-africas-first-offshore-wind-farm/2-1-1074316.
- CSET (2021), Outline of the People’s Republic of China 14th Five-Year Plan for National Economic and SocialDevelopment and Long-Range Objectives for 2035, Center for Security and Emerging Technology, Georgetown University, Washington, D.C., https://cset.georgetown.edu/wp-content/uploads/t0284_14th_Five_Year_Plan_EN.pdf.
- CSIS (2021a), Hydrogen Economy Roadmap of Korea, Center for Strategic and International Studies, www.csis.org/analysis/south-koreas-hydrogen-industrial-strategy.
- CSIS (2021b), Japan’s hydrogen industrial strategy, Center for Strategic and International Studies, www.csis.org/analysis/japans-hydrogen-industrial-strategy.
- den Ouden, B., (2020), A Hydrogen Exchange for the Climate, Dutch Ministry of Economic Affairs and Climate Policy, www.government.nl/documents/reports/2020/09/24/a-hydrogen-exchange-for-the-climate.
- E4Tech (2021), The Fuel Cell Industry Review 2020, www.fuelcellindustryreview.com, (accessed 13 January 2022).
- Egli, F., B. Steffen, B. and T.S. Schmidt (2019), Bias in energy system models with uniform cost of capital assumption. Nature Communication, Vol. 10, 4588. https://doi.org/10.1038/s41467-019-12468-z.
- EIA (n.d.), “Europe Brent spot price FOB (dollars per barrel)”, Energy Information Administration, Washington, D.C., www.eia.gov/dnav/pet/hist/rbrteD.htm.
- Ember (n.d.-a), “China was the only G20 country to see large increase in coal generation in 2020”, https://ember-climate.org/global-electricity-review-2021/g20-profiles/china/.
- Ember (n.d.-b), “India’s wind and solar generation tripled since 2015”, https://ember-climate.org/globalelectricity-review-2021/g20-profiles/india/.
- Emirates News Agency, 2021. "UAE announces Hydrogen Leadership Roadmap, reinforcing Nation’s commitment to driving economic opportunity through decisive climate action", www.wam.ae/en/details/1395302988986, (accessed 13 January 2022).
- Energy Charter Secretariat (2007), “Putting a price on energy: International pricing mechanisms for oil and gas”. Energy Charter Treaty, Brussels. www.energycharter.org/what-we-do/trade-and-transit/tradeand-transit-thematic-reports/putting-a-price-on-energy-international-pricing-mechanisms-for-oil-andgas-2007/.
- Energy Transition Commission (2021), Making the Hydrogen Economy Possible: Accelerating Clean Hydrogen in an Electrified Economy, The Making Mission Possible Series, ETC, www.energy-transitions.org/publications/making-clean-hydrogen-possible/.
- Energy Voice (2021), “CWP signs $40bn MoU with Mauritania on green hydrogen”, 31 May, www.energyvoice.com/renewables-energy-transition/hydrogen/africa-hydrogen/326911/cwp-mou-mauritania-hydrogen/.
- Engineering News (2021), "Namibia selects preferred bidder for pioneering $9.4bn green hydrogen project", 5 November, www.engineeringnews.co.za/article/namibia-may-launch-second-green-hydrogen-biddingprocess-in-early-2022-2021-11-23.
- Equinor and OGE (2019), The potential of hydrogen for decarbonization of German industry, Equinor and Open Grid Europe, www.equinor.com/content/dam/statoil/documents/climate-and-sustainability/H2morrowThe%20Potential-of-Hydrogen-for-Decarbonization-of-German-Industry.pdf.
- European Commission (2021), The European economic and financial system: fostering openness, strengthand resilience, 19 January, Brussels.
- European Commission (2020a), A hydrogen strategy for a climate-neutral Europe, 8 July, Brussels, https://ec.europa.eu/energy/sites/ener/files/hydrogen_strategy.pdf.
- European Commission (2020b), Critical Raw Materials for Strategic Technologies and Sectors in the EU: A Foresight Study, Joint Research Centre, European Commission, Brussels, https://ec.europa.eu/docsroom/documents/42881.
- European Commission (2019), “Fertilisers in the EU: Prices, trade, and use”, EU Agricultural Market Briefs, No. 15, June, https://ec.europa.eu/info/sites/default/files/food-farming-fisheries/farming/documents/marketbrief-fertilisers_june2019_en.pdf.
- FAO (2020), The State of Food and Agriculture 2020. Overcoming water challenges in agriculture, Food and Agriculture Organization, Rome, https://doi.org/10.4060/cb1447en.
- FCH JU (2014), Study on Development of Water Electrolysis in the EU, Fuel Cells and Hydrogen Joint Undertaking, www.fch.europa.eu/sites/default/files/FCHJUElectrolysisStudy_FullReport%20(ID%20199214).pdf.
- FCH JU (n.d.), Discover New FCH JU Project Big Hit: Orkney Islands- A Model Hydrogen Territory, Fuel Cells and Hydrogen Joint Undertaking. www.fch.europa.eu/news/discover-new-fch-ju-project-big-hit-orkney-islandsmodel-hydrogen-territory.
- Field, R. A., and R.G. Derwent (2021), "Global warming consequences of replacing natural gas with hydrogen in the domestic energy sectors of future low-carbon economies in the United Kingdom and the United States of America", International Journal of Hydrogen Energy, Vol. 46, No. 58, pp. 30190-30203.
- Financial Times (2021), “The race to scale up green hydrogen”, Financial Times, 8 March, www.ft.com/content/7eac54ee-f1d1-4ebc-9573-b52f87d00240, (accessed 13 January 2022).
- Fitchratings (2021), Climate Change “Stranded Assets” Are a Long-Term Risk for Some Sovereigns, 15 February, www.fitchratings.com/research/sovereigns/climate-change-stranded-assets-are-long-termrisk-for-some-sovereigns-15-02-2021.
- Fraunhofer ISE (2020), “HySpeedInnovation: A joint action plan for innovation and upscaling in the field of water electrolysis technology”, www.ise.fraunhofer.de/content/dam/ise/en/documents/News/PositionPaper-HySpeedInnovation.pdf.
- Fund for Peace (2021), Fragile States Index Annual Report 2021, Fund for Peace, Washington, D.C., https://fragilestatesindex.org/wp-content/uploads/2021/05/fsi2021-report.pdf.
- Gas for Climate (2021a), Extending the European Hydrogen Backbone, https://gasforclimate2050.eu/sdm_downloads/extending-the-european-hydrogen-backbone/.
- Gas for Climate (2021b), Market State and Trends in Renewable and Low-Carbon Gases in Europe www.europeanbiogas.eu/wp-content/uploads/2021/12/Gas-for-Climate-Market-State-and-Trends-report-2021.pdf.
- Geingob, H. G. (2021), “Namibia is poised to become the renewable energy hub of Africa”, World Economic Forum, 3 October, www.weforum.org/agenda/2021/10/namibia-is-positioned-to-become-the-renewableenergy-hub-of-africa/.
- Ghosh, A. and S. Chhabra (2021), Speed and Scale for Disruptive Climate Technologies: Case for a Global Green Hydrogen Alliance, GCF-CEEW Report, Global Challenges Foundation, Stockholm
- GIE & Guidehouse (2021), “Picturing the value of underground gas storage to the European hydrogen system”, June. www.gie.eu/gie-presents-new-study-picturing-the-value-of-underground-gas-storage-tothe-european-hydrogen-system/.
- Gielen, D. et al. (2021), “EU’s carbon border adjustment mechanism lacks the detail to drive industry’s relocation near clean energy”, Energy Post, 15 June, https://energypost.eu/eus-carbon-border-adjustmentmechanism-lacks-the-detail-to-drive-industrys-relocation-near-clean-energy/.
- Gielen, D. et al. (2020), “Renewables-based decarbonization and relocation of iron and steel making: A case study”, Journal of Industrial Ecology, Vol. 24, No. 5, pp. 1113-25.
- Glaeser, E. L. and J.E. Kohlhase (2004), “Cities, regions and the decline of transport costs”, in Fifty Years of Regional Science, pp. 197-228, Springer, Berlin, Heidelberg.
- Gobierno de Chile (2020), “Estrategia Nacional De Hidrógeno Verde [National Green Hydrogen Strategy]”, November, https://energia.gob.cl/sites/default/files/estrategia_nacional_de_hidrogeno_verde_-_chile.pdf.
- Godula-Jopek, A. (2015), “Introduction”, in Hydrogen Production by Electrolysis, pp. 15, Wiley-VCH, Weinheim.
- Goldman Sachs (2020), Green Hydrogen: The Next Transformational Driver of the Utilities Industry, Goldman Sachs, New York, 22 September, www.goldmansachs.com/insights/pages/gs-research/green-hydrogen/report.pdf.
- Government of Australia (2021), “Future hydrogen industry to create jobs, lower emissions and boost regional Australia”, Media release, www.minister.industry.gov.au/ministers/taylor/media-releases/future-hydrogenindustry-create-jobs-lower-emissions-and-boost-regional-australia.
- Government of Australia (2019), Australia’s National Hydrogen Strategy, www.industry.gov.au/data-andpublications/australias-national-hydrogen-strategy.
- Government of Canada (2020), Canada’s Hydrogen Opportunity, p. 86.
- Government of Namibia (2021), “Pillar 2: Economic advancement. Activity 2: Investigate the feasibility of green hydrogen and ammonia as a transformative strategic industry”, https://hppii.gov.na/activities/activity-2-investigate-the-feasibility-of-green-hydrogen-and-ammonia-as-a-transformative-strategic-industry/.
- GreenInfo Network and Global Energy Monitor, (2021), https://greeninfo-network.github.io/fossil_tracker/ (accessed 13 January 2022).
- Grimm, V. and K. Westphal (2021), “The focus on green hydrogen slows down climate protection,” SWP Point of View, www.swp-berlin.org/en/publication/climate-purists-only-want-green-hydrogen-that-is-a-mistake, (accessed 13 January 2022).
- Grinschgl, J., J.M. Pepe and K. Westphal (2021), “Eine neue Wasserstoffwelt: Geotechnologische, geoökonomische und geopolitische Implikationen für Europa”, [A new hydrogen world: geotechnological, geoeconomic and geopolitical implications for Europe]”, SWP Aktuell, 8 December.
- H2Atlas Africa (2021), Atlas of green hydrogen generation potentials in Africa, www.h2atlas.de (accessed 13 January 2022).
- Harding, R. (2019), “Japan launches first liquid hydrogen carrier ship”, Financial Times, 11 December, www.ft.com/content/8ae16d5e-1bd4-11ea-97df-cc63de1d73f4, (subscription required).
- HELIOS (n.d.), “Fostering cleaner energy for our planet”, www.heliosindustry.com/project/.
- Howarth, R.W. and M.Z. Jacobson (2021), “How green is blue hydrogen?” Energy Science & Engineering, Vol. 9, Issue 10, pp. 1676-1687, https://doi.org/10.1002/ESE3.956.
- Hydrogen Council (2021), Hydrogen for Net Zero: A Critical Cost-Competitive Energy Vector, https://hydrogencouncil.com/wp-content/uploads/2021/11/Hydrogen-for-Net-Zero_Full-Report.pdf.
- HyTechCycling (2020), Assessment of critical materials and components in FCH technologies, http://hytechcycling.eu/wp-content/uploads/d2-1-assessment-of-critical-materials-den-components-in-fchtechnologies.pdf.
- Iberdrola (n.d.), “Iberdrola builds the largest green hydrogen plant for industrial use in Europe”, www.iberdrola.com/about-us/lines-business/flagship-projects/puertollano-green-hydrogen-plant.
- IEA (2021a), Net Zero by 2050, A Roadmap for the Global Energy Sector, International Energy Agency, Paris, https://iea.blob.core.windows.net/assets/deebef5d-0c34-4539-9d0c-10b13d840027/NetZeroby2050-ARoadmapfortheGlobalEnergySector_CORR.pdf.
- IEA (2021b), Methane Tracker 2021 – Analysis, IEA, Paris, www.iea.org/reports/methane-tracker-2021.
- IEA (2021c), Global Hydrogen Review 2021, IEA, Paris, www.iea.org/reports/global-hydrogen-review-2021.
- IEA (2021d), “Could the green hydrogen boom lead to additional renewable capacity by 2026?”, IEA, Paris, 1 December, www.iea.org/articles/could-the-green-hydrogen-boom-lead-to-additional-renewable-capacityby-2026.
- IEA (2021e), Global EV Outlook 2021, IEA, Paris, www.iea.org/reports/global-ev-outlook-2021.
- IEA (2021f), World Energy Outlook 2021, IEA, Paris, www.iea.org/reports/world-energy-outlook-2021
- IEA (2021g), The Role of Critical Minerals in Clean Energy Transitions, IEA, Paris.
- IEA (2020), World Energy Outlook 2020, IEA, Paris, www.iea.org/reports/world-energy-outlook-2020.
- IEA (2019a), The Future of Hydrogen: Seizing today’s opportunities, IEA, Paris.
- IEA (2019b), Africa Energy Outlook 2019 – World Energy Outlook Special Report, IEA, Paris, www.iea.org/reports/africa-energy-outlook-2019.
- IPCC, (2021), Climate Change 2021: The Physical Science Basis. Contribution of Working Group I to the Sixth Assessment Report of the Intergovernmental Panel on Climate Change.
- IRENA and ILO (2021), Renewable Energy and Jobs – Annual Review 2021, International Renewable Energy Agency, International Labour Organization, Abu Dhabi, Geneva.
- IRENA, IEA, REN21 (2020), Renewable energy policies in a time of transition: Heating and cooling, IRENA, Abu Dhabi.
- IRENA INSPIRE webtool (2021), http://inspire.irena.org/Pages/home.aspx (accessed 13 January 2022).
- IRENA (forthcoming-a), Global hydrogen trade to meet the 1.5 °C climate goal: Part II – Technology review of hydrogen carriers, IRENA, Abu Dhabi.
- IRENA (forthcoming-b), Green hydrogen for industry: A guide to policy making, IRENA, Abu Dhabi.
- IRENA (2021a), World Energy Transitions Outlook, IRENA, Abu Dhabi.
- IRENA (2021b), Green Hydrogen Supply: A Guide to Policy Making, IRENA, Abu Dhabi.
- IRENA (2021c), Renewable Power Generation Costs in 2020, IRENA, Abu Dhabi.
- IRENA (2021d), A pathway to decarbonise the shipping sector by 2050, IRENA, Abu Dhabi.
- IRENA (2021e), “Majority of new renewables undercut cheapest fossil fuel on cost”, 22 June, www.irena.org/newsroom/pressreleases/2021/Jun/Majority-of-New-Renewables-Undercut-Cheapest-Fossil-Fuel-on-Cost.
- IRENA (2020a), Green Hydrogen Cost Reduction: Scaling up Electrolysers to Meet the 1.5C Climate Goal, IRENA, Abu Dhabi.
- IRENA (2020b), Green Hydrogen: A Guide to Policy Making, IRENA, Abu Dhabi.
- IRENA (2020c), Energy subsidies: Evolution in the global energy transformation to 2050, IRENA, Abu Dhabi.
- IRENA (2019a), A New World: The Geopolitics of the Energy Transformation, IRENA, Abu Dhabi.
- IRENA (2019b), Renewable Energy Market Analysis: GCC 2019, IRENA, Abu Dhabi.
- IRENA (2018a), Renewable Power-To-Hydrogen - Innovation Landscape Brief, IRENA, Abu Dhabi.
- IRENA (2018b), Water Use in India’s Power Generation: Impact of Renewables and Improved Cooling Technologies to 2030, IRENA, Abu Dhabi.
- IRENA (2016a), A Path to Prosperity: Renewable Energy for Islands, IRENA, Abu Dhabi.
- IRENA (2016b), Water Use in China’s Power Sector: Impact of Renewables and Cooling Technologies to 2030, IRENA, Abu Dhabi.
- IRENA (2015), Renewable Energy in the Water, Energy and Food Nexus, IRENA, Abu Dhabi.
- Jaffe, A.M. and R. Soligo (2006), “Market Structure in the New Gas Economy: Is Cartelisation Possible?” In Natural Gas and Geopolitics: From 1970 to 2040, pp. 439-464, Cambridge University Press, New York.
- Japan Ministry of Environment (2020), Summary of Japan’s hydrogen strategy, www.env.go.jp/seisaku/list/ondanka_saisei/lowcarbon-h2-sc/PDF/Summary_of_Japan’s_Hydrogen_Strategy.pdf.
- Keohane, R.O. and J.S.Nye (2001), Power and Interdependence (3rd ed.), Longman, New York.
- Khalili S., (2019), "Global Transportation Demand Development with Impacts on the Energy Demand and Greenhouse Gas Emissions in a Climate-Constrained World", Energies, Vol. 12, No. 20, 3870. https://doi.org/10.3390/en12203870.
- Kiemel, S., et al. (2021), “Critical materials for water electrolysers at the example of the energy transition in Germany”, International Journal of Energy Research, Vol. 45(7), pp. 9914-9935.
- Kleen, G. and E. Padgett (2021), Durability-adjusted fuel cell system cost, US Department of Energy, 8 January, www.hydrogen.energy.gov/pdfs/21001-durability-adjusted-fcs-cost.pdf.
- The Korea Herald (2019), “S. Korea to build 3 hydrogen-powered cities by 2022”, 10 October, www.koreaherald.com/view.php?ud=20191010000806, (accessed 13 January 2022).
- Koyama, K. (2021), “China replaced Japan as world’s largest LNG importer in 1st half of 2021: A Japanese perspective on the international energy landscape,” 26 July, Institute of Energy Economics, Japan.
- La Repubblica (2021), “Snam, Alverà guarda al futuro: dalla Gigafactory allo stoccaggio” [Snam, Alverà looks to the future: From Gigafactory to storage], https://finanza.repubblica.it/News/2021/11/29/snam_alvera_guarda_al_futuro_dalla_gigafactory_allo_stoccaggio-101/.
- Longden, T., et al. (2022), “’Clean’ hydrogen? – Comparing the emissions and costs of fossil fuel versus renewable electricity based hydrogen”, Applied Energy, Vol. 306,Part B, 118145, www.sciencedirect.com/science/article/pii/S0306261921014215#s0010.
- Lovins, A. (2021a), “Profitably decarbonizing heavy transport and industrial heat: transforming these ’harderto-abate’ sectors is not uniquely hard and can be lucrative”, RMI Innovation Center, Basalt, CO, www.rmi.org/profitable-decarb/.
- Lovins, A. (2021b), “Decarbonizing our toughest sectors – profitably”, MIT Sloan Management Review, 4 August, https://sloanreview.mit.edu/article/decarbonizing-our-toughest-sectors-profitably/.
- Ludwig, M., (2021), The Green Tech Opportunity in Hydrogen, April 12, www.bcg.com/en-in/publications/2021/capturing-value-in-the-low-carbon-hydrogen-market.
- Mander, B. (2020), “Chile seeks to turn solar boom into green hydrogen bonanza”, Financial Times, 31 August, www.ft.com/content/16481d72-1495-4b24-9c59-97ea9a856cc1, (subscription required).
- McWilliams, B. and G. Zachmann (2021), “A new economic geography of decarbonisation?” Bruegel, 8 November, https://www.bruegel.org/2021/11/a-new-economic-geography-of-decarbonisation/#:~:text=The%20interactive%20map.
- MEM (2021), Green Hydrogen Roadmap, Ministry of Energy, Mining, and Environment, Government of Morocco, www.mem.gov.ma/Lists/Lst_rapports/Attachments/36/Feuille%20de%20route%20de%20hydrog%C3%A8ne%20vert.pdf.
- METI (2017), Basic hydrogen strategy, Ministry of Economy, Trade and Industry, Government of Japan, 26 December, www.meti.go.jp/english/press/2017/pdf/1226_003b.pdf, (accessed 13 January 2021).
- Minke, C. et al. (2021), “Is iridium demand a potential bottleneck in the realisation of large-scale PEM water electrolysis?”, International Journal of Hydrogen Energy, Volume 46, Issue 46, pp. 23581-23590.
- Mission Possible Partnership (2021), Net Zero Steel: Sector Transition Strategy, October 2021.
- MOEF (2020), Korea’s green new deal, Ministry of Economy and Finance, www.greenclimate.fund/sites/default/files/event/koreas-green-new-deal-moef-international-conference-green-new-deal.pdf.
- Moya Rivera, J. and A. Boulamanti (2016), Production Costs from Energy Intensive Industries in the EU andThird Countries, EUR 27729, JRC100101, Publications Office of the European Union, Luxembourg, https://op.europa.eu/en/publication-detail/-/publication/7e4fe297-084c-11e6-b713-01aa75ed71a1/language-en.
- Muttitt, G. et al. (2021), Step off the gas: International public finance, natural gas and clean alternatives in the Global South, International Institute for Sustainable Development, June.
- Nagashima, M. (2018), Japan’s hydrogen strategy and its economic and geopolitical implications, French Institute of International Relations (IFRI), October, www.ifri.org/sites/default/files/atoms/files/nagashima_japan_hydrogen_2018_.pdf.
- Niermann, M. et al. (2019), “Liquid organic hydrogen carriers (LOHCs)–techno-economic analysis of LOHCs in a defined process chain”, Energy and Environmental Science, Vol. 12, No. 1, pp. 290-307.
- Open Grid Europe (2021), H2morrow: Act today to be greenhouse gas neutral by 2050, https://oge.net/en/us/projects/our-hydrogen-projects/h2morrow.
- Patonia, A. (2021), “Hydrogen: Savior or boondoggle for Russia?” 18 August, www.gmfus.org/news/hydrogen-savior-or-boondoggle-russia.
- Paulsson, L. and M. Durisin (2021), “Energy crunch hits pig slaughter and fertilizers in risk to food”, Bloomberg, 17 September, www.bloomberg.com/news/articles/2021-09-17/europe-s-energy-woes-hit-fertilizers-in-another-threat-to-food, (subscription required).
- Philibert, C. (2017), Renewable Energy for Industry: From Green Energy to Green Materials and Fuels, IEAInsights Series, OECD/IEA, Paris, https://iea.blob.core.windows.net/assets/48356f8e-77a7-49b8-87de-87326a862a9a/Insights_series_2017_Renewable_Energy_for_Industry.pdf.
- Platinum Matthey, (n.d.), http://www.platinum.matthey.com/prices/price-charts.
- Pollard, S. (1981), Peaceful Conquest: The Industrialization of Europe - 1760-1970, Oxford University Press, Oxford.
- Port of Rotterdam Authority (2020), “Hydrogen vision”, 7 May, www.portofrotterdam.com/sites/default/files/2021-06/hydrogen-vision-port-of-rotterdam-authority-may-2020.pdf.
- Piria, R. et al. (2021), “Critical review of the IPHE working paper ’Methodology for determining the GHG emissions associated with the production of hydrogen’”, Adelphi and Öko Institut e.V., www.adelphi.de, (accessed 13 January 2022).
- Prinzhofer, A., C.S.T. Cissé and A.B. Diallo (2018), “Discovery of a large accumulation of natural hydrogen in Bourakebougou (Mali)”, International Journal of Hydrogen Energy, Vol. 43, No. 42, pp. 19315-19326.
- Radowitz, B. (2021), “Germany eyes world’s cheapest green hydrogen from Namibia amid global ’race for best sites’”, Recharge News, 25 August.
- Ram M. et al. (2020), Powerfuels in a Renewable Energy World - Global volumes, costs, and trading 2030 to 2050, LUT University and Deutsche Energie-Agentur GmbH (dena), Lappeenranta, Berlin.
- Ratcliffe, V., S. El Wardany and M. Martin (2020), “Saudi Arabia aims next to be largest hydrogen exporter”, Bloomberg, 18 November, www.bloombergquint.com/business/biggest-in-oil-saudis-aim-next-to-belargest-hydrogen-exporter.
- Ratcliffe, V., S. Kim and K. Park (2021), “Saudi Arabia to ship gas to South Korea and take CO2 back”, Bloomberg, 3 March, www.bloomberg.com/news/articles/2021-03-03/saudi-arabia-to-ship-gas-to-southkorea-and-take-back-the-co2, (subscription required)
- Recharge News (2021a), “Modi pledges massive green hydrogen ’quantum leap’ to Indian energy independence”, 16 August, www.rechargenews.com/energy-transition/modi-pledges-massive-green-hydrogen-quantumleap-to-indian-energy-independence/2-1-1052701.
- Recharge News (2021b), “’Our largest energy source’: South Korea plans 40 foreign hydrogen bases to meet vast future demand”, 1 December, www.rechargenews.com/energy-transition/our-largest-energy-sourcesouth-korea-plans-40-foreign-hydrogen-bases-to-meet-vast-future-demand/2-1-1110526.
- Recharge News (2021c), “New 10GW green hydrogen project in Mauritania could include Africa’s first offshore wind farm”, 28 September, www.rechargenews.com/energy-transition/new-10gw-green-hydrogen-projectin-mauritania-could-include-africas-first-offshore-wind-farm/2-1-1074316.
- Reuters (2021), “Deutsche Boerse’s EEX to launch hydrogen index in 2022”, www.reuters.com/business/sustainable-business/exclusive-deutsche-boerses-eex-launch-hydrogen-index-2022-2021-11-24/.
- RIA Novosti (2021), “Не только газ: Россия нашла новый способ заработать на Европе” [Not only gas: Russia has found a new way to make money on Europe], https://ria.ru/20210505/vodorod-1729501925.html.
- Ritchie, H. (2017), “How many people does synthetic fertilizer feed?”, Our World in Data, 7 November, https://ourworldindata.org/how-many-people-does-synthetic-fertilizer-feed, updated 30 April 2020.
- Romer, R. (2011), "Fuel cell systems provide clean backup power in telecom applications worldwide," 2011 IEEE33rd International Telecommunications Energy Conference (INTELEC), pp. 1-2, doi: https://doi.org/10.1109/INTLEC.2011.6099732.
- Roos, T. and J. Wright (2021), Powerfuels and Green Hydrogen, EU-South Africa, www.euchamber.co.za/wp-content/uploads/2021/02/Powerfuels-Summary-Report-South-Africa-EU-SA_Partners-for-GrowthFinal-28-Jan-2021.pdf.
- The Russian Government (2021), “Agenda: Draft hydrogen energy development concept, federal support for the regions”, http://government.ru/en/news/42970/, (accessed 13 January 2022).
- Rystad Energy RenewableCube, (2021), "Green hydrogen projects will stay dry without a parallel desalination market to provide fresh water", Press Release, September 27, www.rystadenergy.com/newsevents/news/press-releases/green-hydrogen-projects-will-stay-dry-without-a-parallel-desalination-market-to-providefresh-water, (accessed 13 January 2022).
- S&P Global (n.d.), Hydrogen Price Assessments, S&P Global Platts. London.
- Saunois, M. et al. (2016), “The global methane budget 2000-2012”, Earth System Science Data, Vol. 8, No. 2, pp. 697–751. https://doi.org/10.5194/essd-8-697-2016.
- De Sisternes J., J. Fernando and C.P. Jackson (2020), Green Hydrogen in Developing Countries, World Bank Group, Washington, D.C., http://documents.worldbank.org/curated/en/953571597951239276/GreenHydrogen-in-Developing-Countries.
- Smith, A. (1776), The Wealth of Nations, W. Strahan and T. Cadell, London.
- Smolinka, T., M. Günther and J. Garche (2011), Stand und Entwicklungspotenzial der Wasserelektrolyse zur Herstellung von Wasserstoff aus regenerativen Energien [Status and development potential of electrolysis for the production of hydrogen from renewable energy], Fraunhofer ISE, www.now-gmbh.de/wp-content/uploads/2020/09/now-studie-wasserelektrolyse-2011.pdf.
- Smyth, J. (2021), “Green groups fume as Canberra rejects world’s biggest renewables project”, Financial Times, 21 June, (accessed 13 January 2022).
- Steinberger-Wilckens, R. et al. (Eds.) (2017), The Role of Hydrogen and Fuel Cells in Delivering EnergySecurity for the UK, H2FC Supergen, London.
- Strategy Advisory Committee of the Technology Roadmap and the Society of Automotive Engineers of China (SAE-China) (2016), Hydrogen Fuel Cell Vehicle Technology Roadmap, https://static1.squarespace.com/static/5b7d93fe0dbda3ea011485b9/t/5d93c88ef490cb28e94bd655/1569966226975/FCV+Tech+Roadmap_China.pdf.
- Systemiq (2020), The Paris Effect: How the Climate Agreement is Reshaping the Global Economy, https://www.systemiq.earth/wp-content/uploads/2020/12/The-Paris-Effect_SYSTEMIQ_Full-Report_December-2020.pdf.
- Smyth, J. (2021), “Green groups fume as Canberra rejects world’s biggest renewables project”, Financial Times, 21 June, (accessed 13 January 2022).
- Steinberger-Wilckens, R. et al. (Eds.) (2017), The Role of Hydrogen and Fuel Cells in Delivering Energy Security for the UK, H2FC Supergen, London.
- Strategy Advisory Committee of the Technology Roadmap and the Society of Automotive Engineers of China (SAE-China) (2016), Hydrogen Fuel Cell Vehicle Technology Roadmap, https://static1.squarespace.com/static/5b7d93fe0dbda3ea011485b9/t/5d93c88ef490cb28e94bd655/1569966226975/FCV+Tech+Roadmap_China.pdf.
- Systemiq (2020), The Paris Effect: How the Climate Agreement is Reshaping the Global Economy, https://www.systemiq.earth/wp-content/uploads/2020/12/The-Paris-Effect_SYSTEMIQ_Full-Report_December-2020.pdf.
- Thapliyal, D. (2021), “Fertilizers and the cross-commodity impact of record high gas prices”, Independent Commodity Intelligence Services, www.icis.com/explore/resources/news/2021/10/05/10686659/topic-pagefertilizers-in-the-cross-commodity-impact-of-record-high-gas-prices.
- UCL (n.d.), “Economic rents”, University College London, www.ucl.ac.uk/bartlett/public-purpose/research/economic-rents.
- UN Comtrade (2021), https://comtrade.un.org/data.
- UN General Assembly (2009), Climate change and its possible security implications. Report of the SecretaryGeneral, 11 September United Nations, New York.
- UN (2019), World Population Prospects 2019, United Nations, New York.
- UNCTAD, (2020), Review of Maritime Transport, 2020, United Nations Conference on Trade and Development, https://unctad.org/system/files/official-document/rmt2020_en.pdf.
- UNESCO (2021), The United Nations World Water Development Report 2021: Valuing Water, United Nations Educational, Scientific and Cultural Organization, Paris.
- UNFCCC (2021), “COP26 world leaders summit- statement on the breakthrough agenda”, UN Climate Change Conference UK 2021, United Nations Framework Convention on Climate Change, https://ukcop26.org/cop26-world-leaders-summit-statement-on-the-breakthrough-agenda/.
- US Congress (2021), H.R.5376 – Build Back Better Act, www.congress.gov/bill/117th-congress/housebill/5376/text.
- Van de Graaf, T. and B.K. Sovacool (2020), Global Energy Politics, John Wiley & Sons.
- van Wijk, A. and F. Wouters (2021), “Hydrogen–The Bridge Between Africa and Europe”, in Weijnen M.P.C., Z. Lukszo and S. Farahani (Eds.) Shaping an Inclusive Energy Transition, Springer, Cham, https://link.springer.com/chapter/10.1007%2F978-3-030-74586-8_5.
- Verma, N. (2021), “India to require refiners, fertiliser plants to use some green hydrogen”, Reuters, August 10, (accessed 13 January 2022).
- Vortex (2021a), "Global annual average global horizontal irradiation", IRENA Global Atlas, https://globalatlas.irena.org/workspace.
- Vortex (2021b), "Global annual average wind speed at 100 m height", IRENA Global Atlas, https://globalatlas.irena.org/workspace.
- Wang, X. (2021), “Alkaline vs. PEM: Breaking electrolyzer technologies myths”, 28 July, Bloomberg, (subscription required).
- WEC (2021), “National hydrogen strategies”, World Energy Council, London, www.worldenergy.org/assets/downloads/Working_Paper_-_National_Hydrogen_Strategies_-_September_2021.pdf.
- Weidlich, B. (2021), “Namibia optimistic about new green hydrogen industry”, 8 November, https://namibian.org/news/economics/namibia-optimistic-about-new-green-hydrogen-industry.
- White, L.V. et al. (2021), “Towards emissions certification systems for international trade in hydrogen: The policy challenge of defining boundaries for emissions accounting”, Energy, Vol. 215, 119139.
- World Bank (n.d.-a), “GDP (current, US$)”, World Bank, Washington DC, https://data.worldbank.org/indicator/NY.GDP.MKTP.CD.
- World Bank (n.d.-b), “Energy imports, net (% of energy use), World Development Indicators.” https://data.worldbank.org/indicator/EG.IMP.CONS.ZS.
- World Bank (n.d.-c), “Annual freshwater withdrawals, total (billion cubic meters)”, https://data.worldbank.org/indicator/ER.H2O.FWTL.K3.
- World Bank (n.d.-d), “Fertiliser consumption (kilograms per hectare of arable land)”, https://data.worldbank.org/indicator/AG.CON.FERT.ZS.
- World Energy Council (2021), Hydrogen on the horizon: Hydrogen demand and cost dynamics, World Energy Council, September 2021, www.worldenergy.org/publications/entry/working-paper-hydrogen-demandand-cost-dynamics.
- Zgonnik, V. (2020), “The occurrence and geoscience of natural hydrogen: A comprehensive review”, EarthScience Reviews, Vol.203, 103140.
Foreword
The accelerating deployment of renewables has set in motion a global energy transformation with farreaching geopolitical implications. The report “A New World”, released in 2019 by IRENA’s Global Commission on the Geopolitics of the Energy Transformation, was the first foray into this area. It highlighted how the advent of a new energy age would reshape relations between states and communities and bring about a “new world” of power, security, energy independence and prosperity.
Given the fast pace of change, it is critical to monitor the geopolitical drivers and implications of the transition, stay abreast of developments and play an active role in shaping the future. In 2020, the IRENA Assembly requested the Agency to advance this work under the Collaborative Framework* on the Geopolitics of the Energy Transformation. Hydrogen was identified as a prominent area for further analysis, given the recent surge of interest. Several times in the past, hydrogen attracted much attention but remained a niche in the global energy discourse. Today, the policy focus is unprecendented, given its central role for decarbonisation of harder-to-abate sectors.
There are still many uncertainties about how the hydrogen market will develop, who will emerge as market leaders, and what the geopolitical implications may be. In writing this report, IRENA provides an informed analysis about how these uncertainties could play out. Much will depend on the policy frameworks governments put in place, including the incentives they choose against a backdrop of the social and economic consequences of a global pandemic, the increasingly evident climate impacts and the urgency to decrease the gap between the haves and have-nots.
IRENA’s World Energy Transitions Outlook envisages it could meet up to 12 percent of final energy consumption by 2050. To achieve this, it will be essential to set the priorities right, especially early on, while markets are developing and costs are high.
And hydrogen’s positive contribution to climate and development efforts will be ensured only with transparent and credible rules and standards and a coherent system that transcends national, regional and sectoral boundaries. Crucially, with international co-operation, the emerging hydrogen market has the potential to be both decentralised and inclusive, with opportunities for developed and developing countries alike.
We have a long way to go. For example, just as the UN Climate Conference kicked off in Glasgow in October 2021 an energy crisis took hold of global energy markets. The volatility of oil and gas prices triggered a range of emergency measures to reduce the impacts on producers and consumers worldwide. These are a stark reminder of the persistent centrality of fossil fuels to the geopolitics of energy. They also underscore the urgency of the move to resilient energy systems, aligned with the climate and development imperatives set out in the Paris Agreement and the Agenda 2030.
Today, governments have a unique opportunity to shape the advent of hydrogen, by contributing to the design of markets supportive of the energy transformation while avoiding existing limitations and inefficiencies, reducing inequalities, and influencing geopolitical outcomes towards cleaner and fairer energy systems. The challenges are many, but so are the opportunities. I hope that this report will help policy makers and stakeholders effectively navigate the unknowns, mitigate risks and overcome obstacles in the years ahead.

Director-General International Renewable Energy Agency
Acknowledgements
This report has been developed under the guidance of Elizabeth Press who also developed the summary and policy considerations. Authors include Thijs Van de Graaf (IRENA consultant and lead author), Herib Blanco, Emanuele Bianco and Waiman Tsang. Rabia Ferroukhi and Dolf Gielen provided expert guidance and oversight.
Valuable contributions were provided by IRENA colleagues: Roland Roesch, Francisco Boshell, Francesco Pasimeni, Paul Komor, Anastasia Kefalidou, Claire Kiss, Emanuele Taibi, Ute Collier, Kathleen Daniel, Imen Gherboudj, Barbara Jinks, Jeffrey Lu, Stefano Marguccio and Kelly Rigg (IRENA consultant).
Many government officials and international experts also provided input and reviewed drafts of the report. Their comments and suggestions were of immense value. They include Ronnie Belmans (KU Leuven), Leonardo Beltrano (Columbia Center on Global Energy Policy), Peter Betts, Kingsmill Bond (Carbon Tracker), Hugo Brouwer (Ministry of Foreign Affairs, Netherlands), Melinda Crane, Matthias Deutsch (Agora Energiewende), Gonzalo Escribano (Real Instituto Elcano), Han Feenstra (Ministry of Economic Affairs and Climate Policy, Netherlands), Lisa Fischer (E3G), Gniewomir Flis (Agora Energiewende), Jonathan Gaventa (E3G), Hans Olav Ibrekk (Ministry of Foreign Affairs, Norway), Ruud Kempener (Directorate-General for Energy, European Commission), Holger Klitzing (Federal Foreign Office, Germany), James Mnyupe (Office of the President, Namibia), Paul Munnich (Agora Energiewende), Alejandro Nuñez-Jimenez (Harvard University and ETH Zurich), Indra Overland (NUPI), Karsten Sach (Ministry for the Environment, Germany), Beatrix Schmuelling (Ministry of Climate Change and Environment, United Arab Emirates), Griffin Thompson (Loyola University Chicago), Nikos Tsafos (CSIS), Tatiana Ulkina (SNAM), Coby van der Linde (Clingendael), Kirsten Westphal (H2Global Stiftung), Ralf Vermeer (Ministry of Foreign Affairs, Netherlands) and Frank Wouters (Reliance Industries). This report also benefitted from IRENA’s Collaborative Framework on Geopolitics of Energy Transformation, which met on two occasions to discuss the topic.
Many experts also participated in surveys that informed the report’s development and provided valuable comments. They includei Marco Baroni, Erin M. Blanton, Noam Boussidan, James Bowen, Michael Bradshaw, Andy Calitz, Kilian Crone, Fernando de Sisternes, Christian Downie, Reshma Francy, Julio Friedmann, Arunabha Ghosh, Marco Giuli, Chris Goodall, Maria A. Gwynn, Lior Herman, Wouter Jacobs, Sohbet Karbuz, Thierry Lepercq, Robin Mills, Eleonora Moro, Monica Nagashima, Michel Noussan, Mostefa Ouki, Jorge Pena, Cédric Phillibert, Rainer Quitzow, Aurangzeb Qureshi, Alison Reeve, Baris Sanli, Massimo Santarelli, Roberto Schaeffer, Daniel Scholten, Rossana Scita, Radia Sedaoui, Adnan Shihabeldin, Tom Smolinka, Alexandre Szklo, Rudiger Tscherning, Frank Umbach, Paul van Son, Ad van Wijk, and Cyril Widdershoven.
The publication, communications and editorial support were provided by Stephanie Clarke, Daria Gazzola, NIcole Bockstaller and Damian Brandy. The report was copy-edited by Steven B. Kennedy. The graphic design was done by weeks.de Werbeagentur GmbH.
IRENA is grateful for the generous support of the Federal Foreign Office of Germany, and the Ministry of Foreign Affairs of Norway which made this report possible.